
Why are the current strong spot demand in the crypto market lagging behind?

Reprinted from jinse
05/16/2025·21DSource: Glassnode; Translated by: Wuzhu, Golden Finance
summary
-
Bitcoin has risen from $35,000 to a local high of $104,000, thanks to a significant increase in on-chain transaction volume.
-
Especially in the range of $93,000 to $95,000, a large number of trades appear to have been traded, which has now become a key level of short-term support.
-
Off-chain spot capital flows also turned positive, Coinbase's net buying pressure was strong, while Binance's selling pressure was weakened. This shows that "buy on dips" behavior still dominates the two major exchanges.
-
ETF inflows peaked at $389 million per day on April 25, helping to drive Bitcoin’s rise, but has since slowed to a more modest $58 million per day.
-
The perpetual contract market appears to lag behind the spot market, as open positions are caused by short squeezes, which leads to liquidation of many accounts betting on Bitcoin’s rise.
Positive spot demand
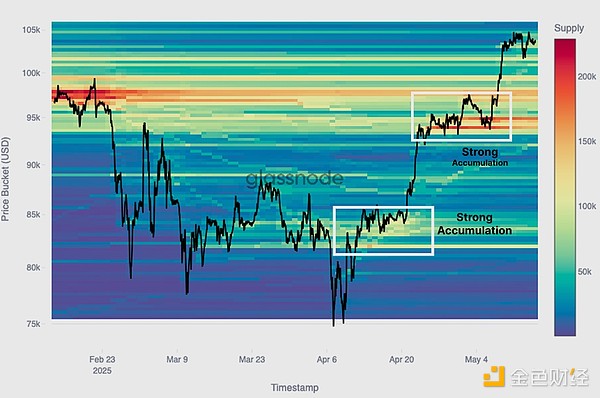
Since hitting a low of $75,000 on April 9, the Bitcoin market has experienced a strong spot-driven rebound, with a clear horizontal accumulation phase between each rise.
We can see this step-by-step pattern in the Cost Base Distribution (CBD) heat map showing the supply clusters accumulated over the past three months at similar price levels.
From this, we can see the accumulation mechanism formed before each rise, which eventually reached US$104,000 in the latest round of rise.
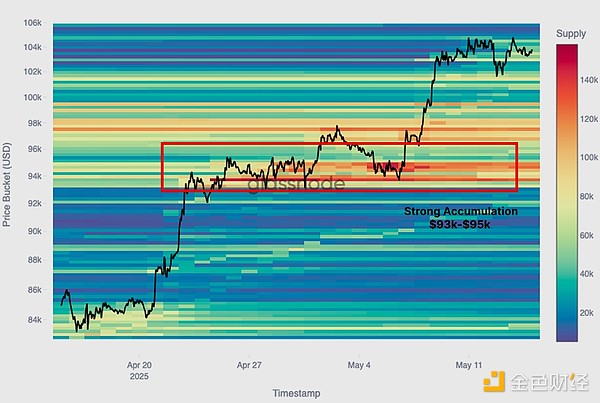
Over the past 30 days, we can also see that a key area of fund-absorbing has emerged between $93,000 and $95,000. This range is highly consistent with the cost benchmark for short-term holders (representing investors entering the market within the past 155 days).
Therefore, if the market sees a short-term pullback, the region is likely to become a strong support level, representing that investors may see the demand area of value again.
Positive deviation of spot flow
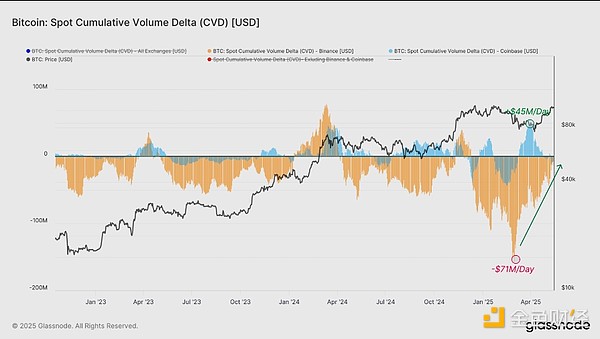
In addition to these on-chain signals, off-chain order flow indicators can also provide valuable information to understand market sentiment and bias. One of the indicators is the Cumulative Spot Volume Increment (CVD), which tracks the pressure of net buying or selling in the spot order book. We can evaluate the strength and direction deviation of the spot market by studying this indicator from the main trading platforms.
The following figure highlights the spot CVD indicators for Binance and Coinbase. Coinbase has been in a continuous net buying state since mid-April, with the CVD peaking at +$45 million per day, consistent with the accelerated market uptrend. By contrast, the Binance market has shifted from a strong net selling pressure of -$71 million in mid-March to a more modest daily -$9 million today, reflecting a significant drop in seller pressure.
The consistency between the accumulated volume on-chain and the off-chain spot demand helps determine that the price rise to $104,000 is supported by real buying activity. Ideally, the convergence of buyer strength in these two dimensions will continue to play a role in maintaining the medium-term bullish outlook.
Measuring institutional investors' interests
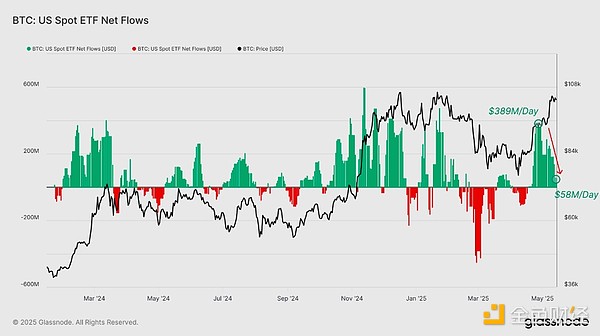
Traditional investors' participation in the Bitcoin market has been growing, especially since the launch of spot ETFs. Monitoring the inflows and outflows of these products can provide valuable perspectives on the emotions, beliefs and needs of institutional investors. It is worth noting that on April 25, the average weekly net inflow of ETF wallets reached a peak of US$389 million per day, which coincides with the surge in spot-driven buying and supports the rise of Bitcoin price to US$104,000. Since then, ETF inflows have dropped to about $58 million per day.
The flow of funds in these ETFs suggests that institutional investors ' interest in Bitcoin remains relatively strong, with inflows comparable to the market rebound period before 2024.
Approximate high point
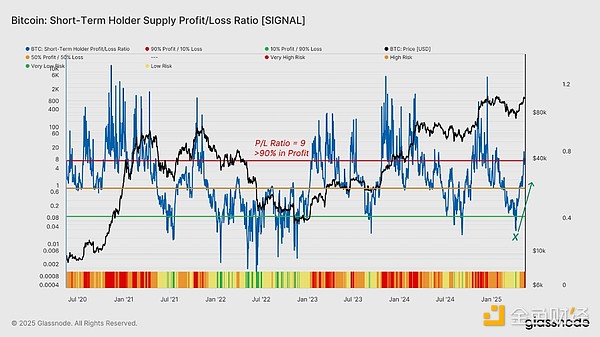
As Bitcoin is currently trading just below its all-time high of $109,000, the market is starting to reappear signs of excitement. One of the most sensitive tools to track this shift is the Short-term Holder (STH) Supply Profit-loss Ratio, which reflects the mood changes in active investors.
The indicator was particularly important in the April 7 pullback, when the ratio dropped to 0.03, indicating that almost all STH held supply was in a loss state. The market hit that level when it hit a low of $76,000, and since then the ratio soared above the key threshold of 9.0, meaning more than 90% of STH supply has now returned to profitability.
Generally speaking, high value may be consistent with high-risk market conditions because investors start to take profits. These conditions may last for a while, but if new demand inflows slow, they usually precede the profit- taking phase or the formation of a local top.
As long as the ratio is much higher than the equilibrium level of 1.0, the bullish momentum can often be maintained. However, any phenomenon of sustained breaking below this level may indicate a major shift in market power and may experience a trend depletion.
Profit retreatment begins, but there is still room for upward
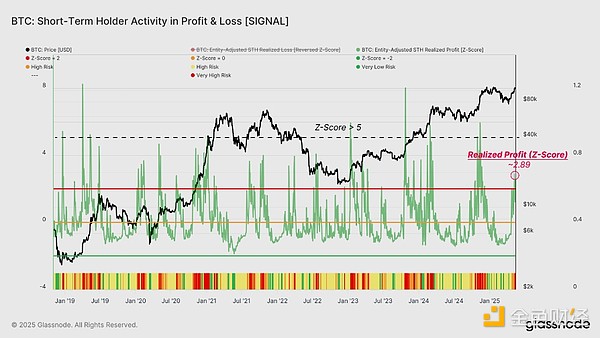
Given that Short-term Holders (STH) currently hold unrealized gains, it is normal for them to expect an increase in profit-taking activity. Monitoring the behavioral rebound in this group is key to judging when demand exhaustion may approach near potential local tops.
Recently, the margin of STH's profit has soared to nearly +3 standard deviations above the 90-day average, reflecting a significant increase in profits. The indicator's all-time highest has climbed to more than +5 standard deviations in the past cycle, especially during the period when prices rose to their all-time highs. This suggests that stronger profit-taking pressure is often needed to overwhelm the inflow of demand.
Derivatives market lags behind
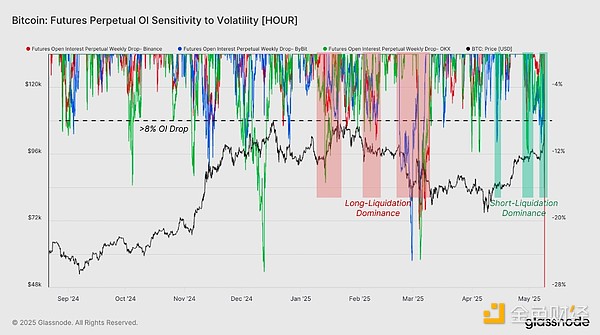
While the strong trend in the spot market is closely related to the recent rebound, it takes longer for traders in derivatives markets to adjust. A more effective tool to measure market sentiment in this space is the open contract (OI) in the perpetual contract market, denominated in Bitcoin (BTC). Tracking weekly changes in open contracts (OIs) across major platforms can help you see whether speculators expect market trends or are surprised by market trends.
Since January 2025, the indicator has shown its practicality in identifying points that investors are surprised by the market trend, and investors are often forced to close their positions. During the period when the price fell below $80,000, the market experienced multiple contractions of open positions (OIs) with more than 10% weekly contraction. This clearly shows that as the price approaches liquidation level, long positions that are overly leveraged are forced to close.
Interestingly, a similar situation has occurred in the recent rebound of over $90,000, and an open contract (OI) has also experienced a similar contract, but this contraction indicates a short position. Such oscillations are characteristic of healthy resets of derivative positions and are usually seen in the early stages of new market trends. The emergence of such squeezes suggests that this rebound has cleared too much leverage, laying the foundation for a stronger upward trend.
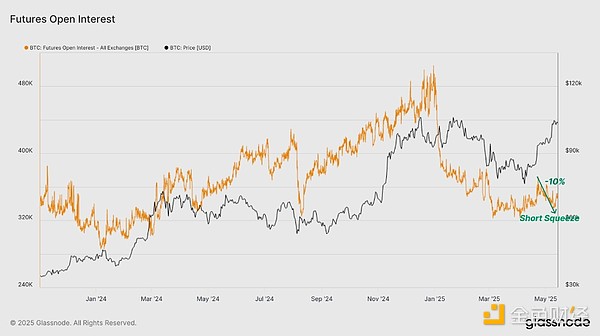
As leveraged short positions were cleared, the number of open futures contracts fell by 10%, from 370,000 BTC to 336,000 BTC. This decline gives us a general understanding of the scale of short squeeze. This process also reduces the likelihood of unhealthy deleveraging events and may weaken the possibility of short-term price volatility.
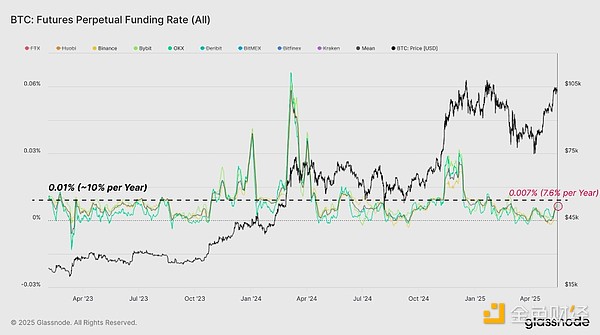
The relatively light long positions in the perpetual contract market are another key signal that derivatives are catching up with the momentum of the spot market. Financing rates on major exchanges are one of the most effective tools to measure these market directional tendencies, and in the past few weeks, financing rates have remained neutral despite the bullish momentum of the market.
As shown in the figure below, average and individual financing rates have been steadily recovering since late April, and are currently hovering around 0.007% (7.6% annualized). This rise reflects a positive shift, indicating that the perpetual contract market 's preference for long exposure is not overly high. The long leverage in the market seems to be limited at the moment, which is a healthy signal.
The options market is heating up
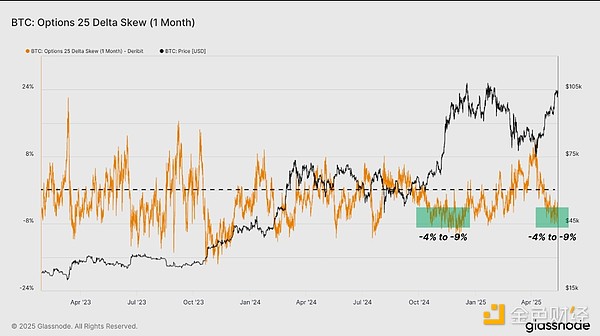
Options market data, especially through a 1-month 25 Delta slope, can find a complementary perspective to observe market sentiment. This indicator is calculated by implicit volatility (IV) of 25 Delta put options minus implicit volatility of 25 Delta call options. Therefore, a negative slope indicates that the call option is priced higher than the put option, which indicates that traders are betting on the uptrend more aggressively, which is often a sign of potential bullish sentiment.
Currently, the 25 Delta slope (1 month) has dropped to -6.1%, which means the implied volatility of call options is significantly higher than that of put options. This reflects a clear shift in risk appetite behavior, as options traders tend to be bullish speculation rather than hedging downside risks.
While the sustained negative inclination is not a clear signal in itself, the sustained negative inclination, especially after a strong rise, is usually consistent with the rise in market optimism. To keep the options market in sync with bullish spot dynamics, we want to see this deviation stay below or near neutral levels, thereby increasing confidence in the strength of the rebound.
in conclusion
Bitcoin’s rebound to its all-time high is driven primarily by the spot market, based on strong on-chain positions and supportive off-chain capital flows. Demand appears to come primarily from large spot exchanges such as spot ETFs and Coinbase. The emergence of key cost benchmark support levels around $95,000 and the cooling of seller pressure have further strengthened the intensity of this uptrend.
However, derivatives markets appear to be catching up, with open contracts and financing rates not fully aligned with the rising momentum of the spot market. Positions in the options market reflect a cautious but optimistic outlook, and there are few signs of excessive long leverage in the futures market at present.


 panewslab