Spot Bitcoin ETF inflows declined, but BTC giant whale indicates accelerated bull market

Reprinted from jinse
05/16/2025·19DAuthor: Biraajmaan Tamuly, CoinTelegraph; Translated by: Deng Tong, Golden Finance
summary
-
Spot Bitcoin ETF inflows plummeted more than 90% from $3 billion in four weeks to $228 million.
-
While strong ETF inflows usually drive Bitcoin up, recent data suggests that price volatility may occur independently.
-
Despite short-term selling pressure, BTC Whale's long-term buying suggests that the BTC uptrend may continue.
Inflows in bitcoin market spot BTC exchange-traded funds (ETFs) plummeted more than 90%, plunging from $3 billion in the last week of April to $228 million this week.
Historically, slowing ETF inflows has had an impact on BTC prices, especially with an average inflow of more than $1.5 billion for consecutive weeks. To understand the potential impact of ETFs on Bitcoin, let’s analyze the four critical periods of high activity in spot ETFs and their correlation with BTC price trends.
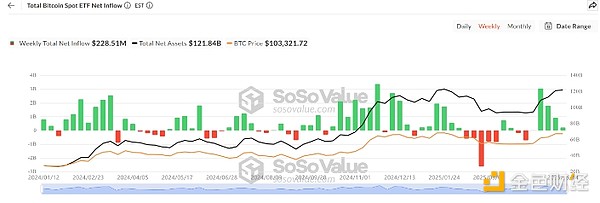
Net inflow of spot Bitcoin ETFs. Source: SoSoValue
In the first quarter of 2024, from February 2 to March 15, spot ETFs recorded a net inflow of $11.39 billion in seven weeks, driving prices to soar by 57%. However, BTC prices peaked in week 5 as $4.8 billion inflows in the last two weeks did not push up its value.
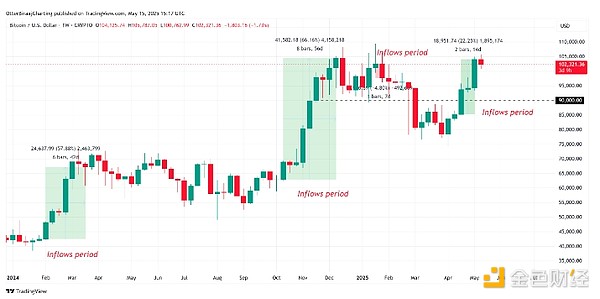
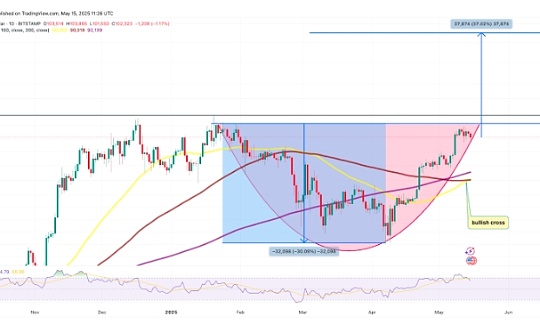
Bitcoin weekly trend chart. Source: Cointelegraph/TradingView
Similarly, in the third quarter of 2024, Bitcoin inflows reached $16.8 billion in the nine weeks from October 18 to December 13, driving its price to rise 66%. However, when inflows slowed down in Week 10, Bitcoin price fell 9%, strengthening the link between ETF inflows and price pullbacks.
In the first quarter of 2025, inflows reached US$3.8 billion in two weeks (January 17-24), and hit an all-time high of US$110,000 on January 20, but the overall price fell 4.8%.
Recently, inflows of $5.8 billion in the second quarter of 2025 (April 25 to May 9) reached US$5.8 billion, with a price increase of 22%, despite negative net inflows in the previous two weeks.
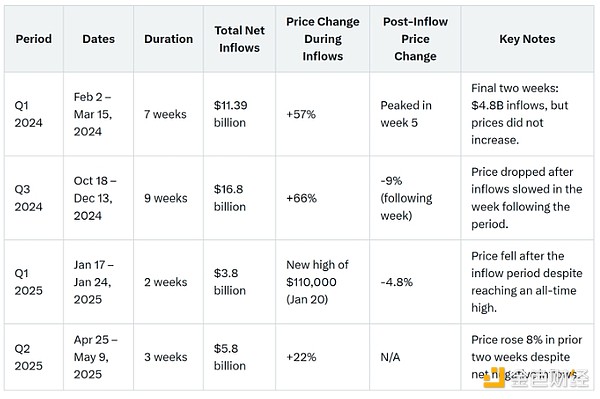
The correlation between Bitcoin price and spot ETF. Data source: SoSoValue, Cointelegraph
These data challenge the view that spot ETF inflows continue to drive price increases. While strong inflows in the third quarter of 2024 and the second quarter of 2025 suggest that strong inflows have driven prices, data for the first quarter of 2024 and the first quarter of 2025 show that prices may still stagnate or fall despite large inflows. The rise in the second quarter of 2025 was partly independent of spot ETF activity, suggesting other drivers such as lower U.S. tariffs, retail investor interest or hoarding of bitcoin whales.
Given the current inflow of $228 million, the historical trend tends to be bearish, suggesting a possible pullback. However, recent whales ' activities have shown the opposite view, depicting a more optimistic picture.
Bitcoin is under pressure to sell, but whales may continue this trend
Alphractal CEO Joao Wedson said that as the buy/sell pressure difference becomes negative, Bitcoin is facing selling pressure in the short term. The chart shows that whales began selling bitcoin between $105,000 and $100,000, and Wedson marked this level as risk. This bearish trend, coupled with the negative cumulative trading volume difference, indicates that there is selling pressure in the short term.
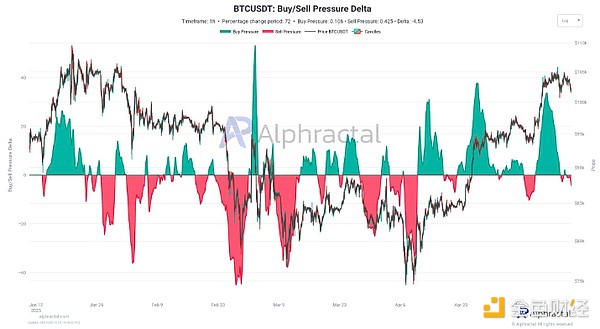
Bitcoin buy/sell pressure increment. Source: X.com
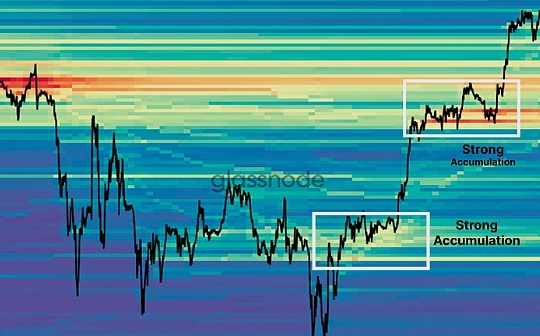
However, long-term buying pressure remains strong, indicating that the decline is a pullback, not a reversal. CryptoQuant data shows that whales have gained profits in the current period relatively lower than previous price peaks. "We can see a significant reduction in profit-taking in whales in recent soars compared to previous rebounds. This may indicate that the uptrend may continue. This chart deserves close attention."
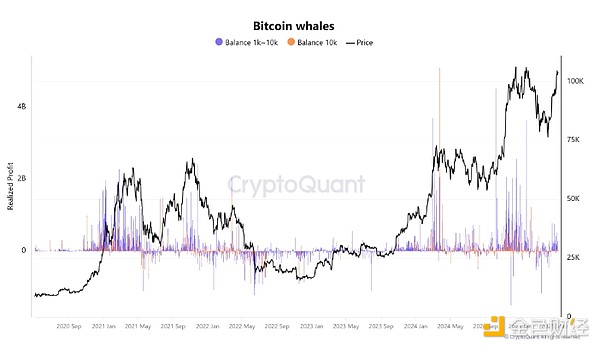
Bitcoin whale. Source: CryptoQuant

 panewslab