6 Big Signs Show BTC’s Next Target is $140,000

Reprinted from jinse
05/16/2025·19DAuthor: Nancy Lubale, CoinTelegraph; Compilation: Baishui, Golden Finance
summary
-
Bitcoin price is pulling back, but strong ETF inflows, high network activity and giant whale's increase in holdings suggest that BTC is expected to exceed $140,000.
-
Spot Bitcoin ETFs have net inflows of $2.9 billion in two weeks, continuing the past upward trend.
-
The decline in exchange balances and the increase in trading volume Z value indicate that overall demand is growing.
Bitcoin price has fallen by 1.4% in the past 24 hours. Its trading price is down 6% from its all-time high of $109,000 set on January 20. Nevertheless, some fundamentals, on-chain data and technical indicators show that Bitcoin’s upside is not over yet.
Spot Bitcoin ETF inflows are exactly the same as BTC’s historical rise
Bitcoin’s latest rebound is accompanied by strong demand for spot Bitcoin exchange-traded funds (ETFs), with spot Bitcoin ETFs net inflows reaching $2.9 billion in the past two weeks.
The figure below shows that since the launch of the U.S. spot Bitcoin ETF in January 2024, these investment products have net inflows of approximately US$8.5 billion between February 13, 2024 and March 13, 2024, and reached a peak of US$1.045 billion inflows on March 12, 2024.
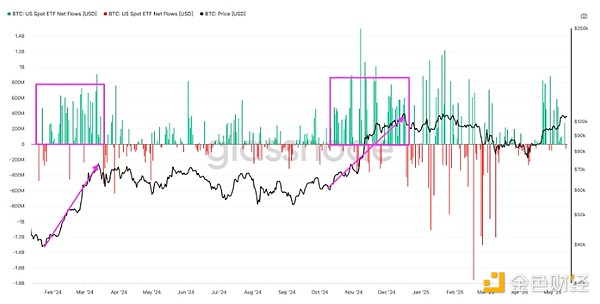
Spot Bitcoin ETF capital flow. Source: Glassnode
Similarly, from November 6, 2024 to December 16, 2024, the cumulative daily inflow reached US$5.7 billion, consistent with Bitcoin's trend of rising from US$67,000 to US$108,000 in the same period, with an increase of 60%.
If ETFs continue to flow in, Bitcoin is likely to resume its upward trend, hitting record highs.
Bitcoin Market Volatility Index: Risk Preference
The increase in funds flowing into spot Bitcoin ETFs indicates a high risk appetite sentiment, as evidenced by the decline in the Chicago Options Exchange (CBOE) Volatility Index (VIX). The index measures 30-day market volatility expectations.
Bitcoin network economist Timothy Peterson stressed that the VIX index has dropped sharply from 55 to 18 in the past 25 trading days.
A VIX index below 18 means a "risk preference" environment, which is beneficial to assets such as Bitcoin.
"This will remain a 'risk-favorite' environment for the foreseeable future," the analyst said.
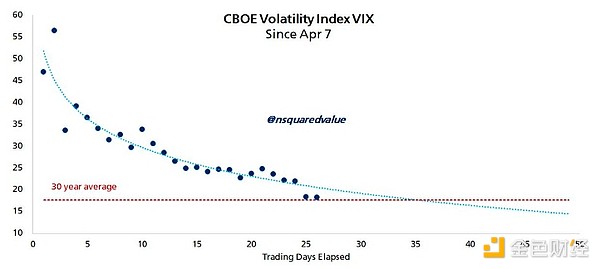
Chicago Options Exchange Volatility Index. Source: Timothy Peterson
Peterson's model tracking accuracy is 95%, and if VIX remains low, the model predicts a target price of $135,000 in the next 100 days.
Bitcoin continues to increase strongly
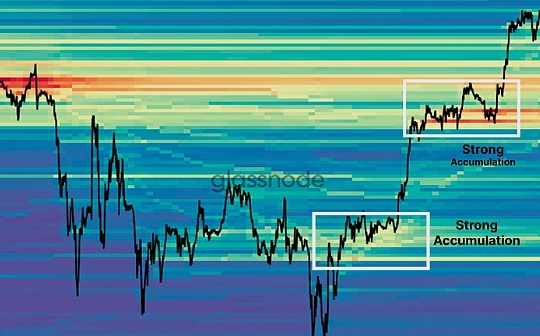
Bitcoin whales’ overweight behavior reinforces risk appetite, and they have been overweight even as prices rise. Glassnode data shows that the Bitcoin Overweight Trend Score (ATS) is 1 (see chart below), indicating that large investors are actively increasing their holdings.
According to Glassnode, the surge in trend scores indicates that almost all groups have shifted from dispersion to overweight. The shift is similar to a similar overweight pattern observed in October 2024, when US President Donald Trump won the election and the price of Bitcoin soared from $67,000 to $108,000.

Bitcoin Cumulative Trend Score. Source: Glassnode
Additional data from Santiment shows that addresses holding 10 to 10,000 BTC have accumulated an increase in holdings of 83,105 BTC in the past 30 days.
Santiment said in a post on X social platform on May 13:
“With these large wallets aggressively increasing their holdings, it may only be a matter of time before Bitcoin breaks through the coveted $110,000 all-time high, especially after the suspension of tariffs between China and the United States.”
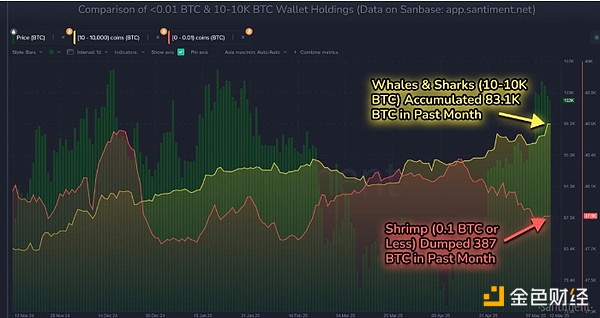
Bitcoin 10-10,000 BTC holding chart. Source: Santiment
Overall, this is a positive signal as the continued accumulation indicates bullish sentiment from this group of investors.
Bitcoin balance on exchanges falls
On May 15, the exchange's Bitcoin balance fell to 2.44 million, the lowest level in six years. According to the figure below, more than 110,000 Bitcoins have been transferred from the exchange in the past 30 days.
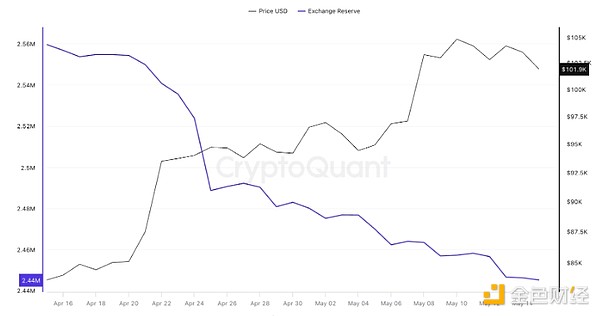
BTC reserves on exchanges. Source: CryptoQuant
The reduced exchange bitcoin balance means investors may be withdrawing their tokens to a self-custodial wallet, indicating their lack of willingness to sell out in the expected future price increase.
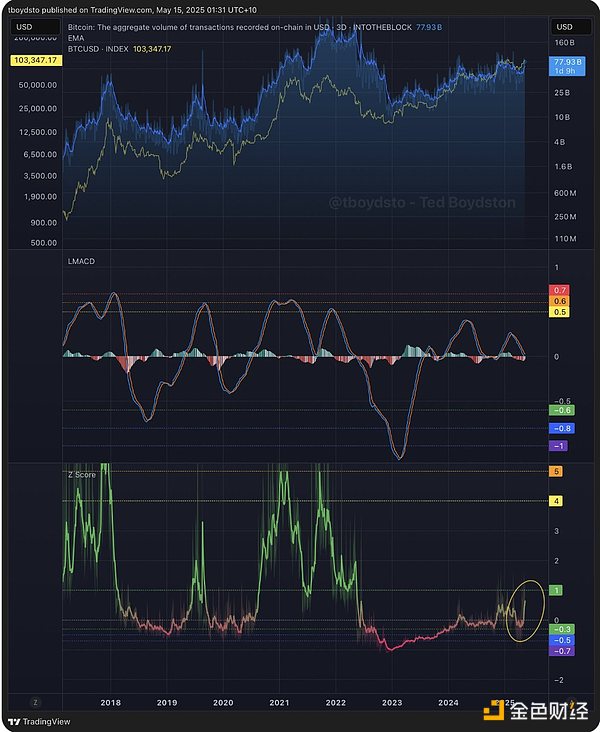
Increased network activity
As cryptocurrency investor Ted Boydston highlighted in an article in the section X on May 15, Bitcoin’s upside potential is supported by increased network activity.
Bitcoin volume Z value measures the difference between the current trading volume and the average trading volume. It is often used to measure network activity and market interest.
The figure below shows that the indicator has risen sharply from the negative value area, approaching 1. The rise in the Z value of trading volume, especially when it is close to or exceeds 1, has historically been associated with rising Bitcoin prices.
“This is a good sign that Bitcoin’s price is accelerating upward,” Boydston commented, adding: “Once the Z value breaks through 1, Bitcoin should enter a bull market.”
BTC round bottom pattern target price $140,000
From a technical point of view, Bitcoin price has formed a round bottom pattern on the daily chart (see the figure below). The bulls are currently focusing on pushing prices to break through the dominant pattern neckline of $106,660.
If the daily K-line closes above this level, it will confirm that the bullish breakout through the round bottom pattern will lead BTC into the price discovery stage. The technical target price is set to US$140,000, up 37% from the current level.
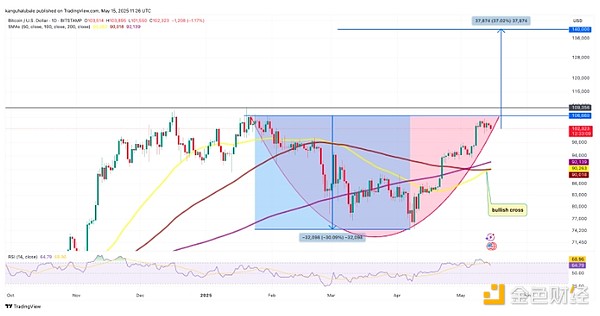
BTC/USD daily chart. Source: TradingView
The Relative Strength Index (RSI) is at 70 and has a bullish cross with SMA, indicating that the market environment is still positive and the price may even break above $140,000.
BTC prices broke through the bull market flag on the weekly chart and are expected to rebound to $150,000.

 panewslab