
Interpretation of Bitcoin trends in 2025 from data indicators and macroeconomic perspectives

Reprinted from panewslab
01/05/2025·5MAuthor: Bitcoin Magazine Pro
Compiled by: Vernacular Blockchain
As we head into 2025, it’s time to take a rational and analytical look at what Bitcoin may be facing this year. By combining multiple factors such as on-chain data, market cycles, macroeconomic data, and more, we can move beyond mere speculation and paint a data-driven picture of the coming months.
1. MVRV Z-Score: Huge upside potential
The MVRV Z-Score measures the ratio between Bitcoin’s realized price (the average purchase price of all Bitcoins on the network) and its market capitalization. By normalizing this ratio for volatility, we get the Z-Score, a metric that has historically provided a clear picture of market cycles.
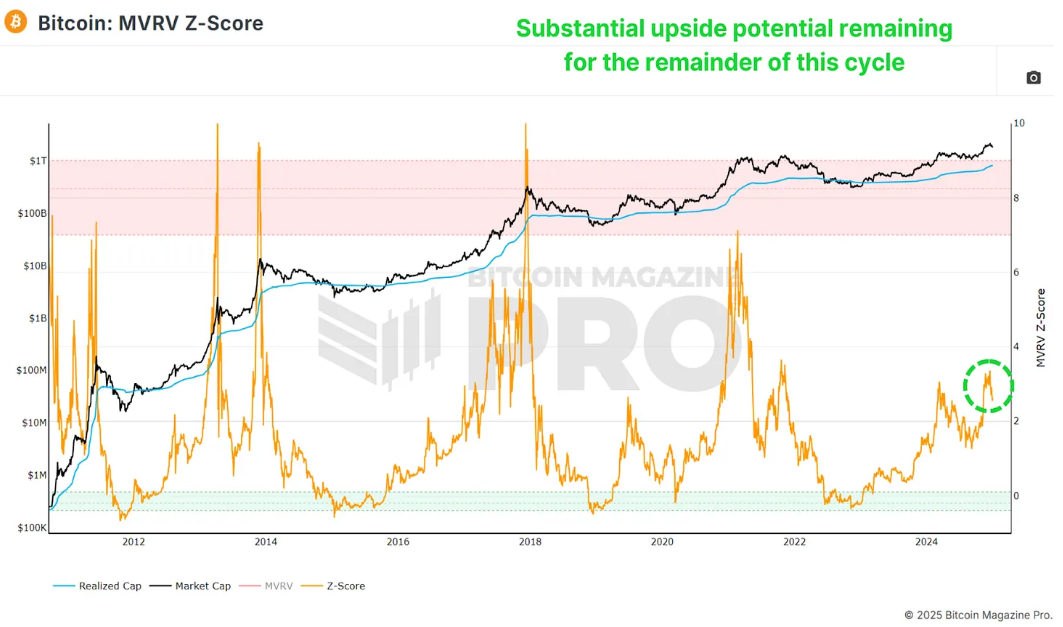
Figure 1: MVRV Z-Score shows we are still a long way from market cycle peak
Currently, the MVRV Z-Score suggests we still have significant upside potential. Although Z-Score has exceeded 7 in previous cycles, I believe that anything above 6 indicates that the market is overextended and requires a closer look at market peaks in conjunction with other indicators. Currently, we are at levels comparable to May 2017 - when the price of Bitcoin was only a few thousand dollars. Given the historical context, there is still room for potential gains of several hundred percentage points from current levels.
2. PiCycle Oscillator: Bullish momentum restored
Another key indicator is the PiCycle Top and Bottom indicator, which tracks the 111-day and 350-day moving averages (the latter multiplied by 2). Historical data shows that when these two moving averages cross, it usually indicates that Bitcoin price will peak within a few days.
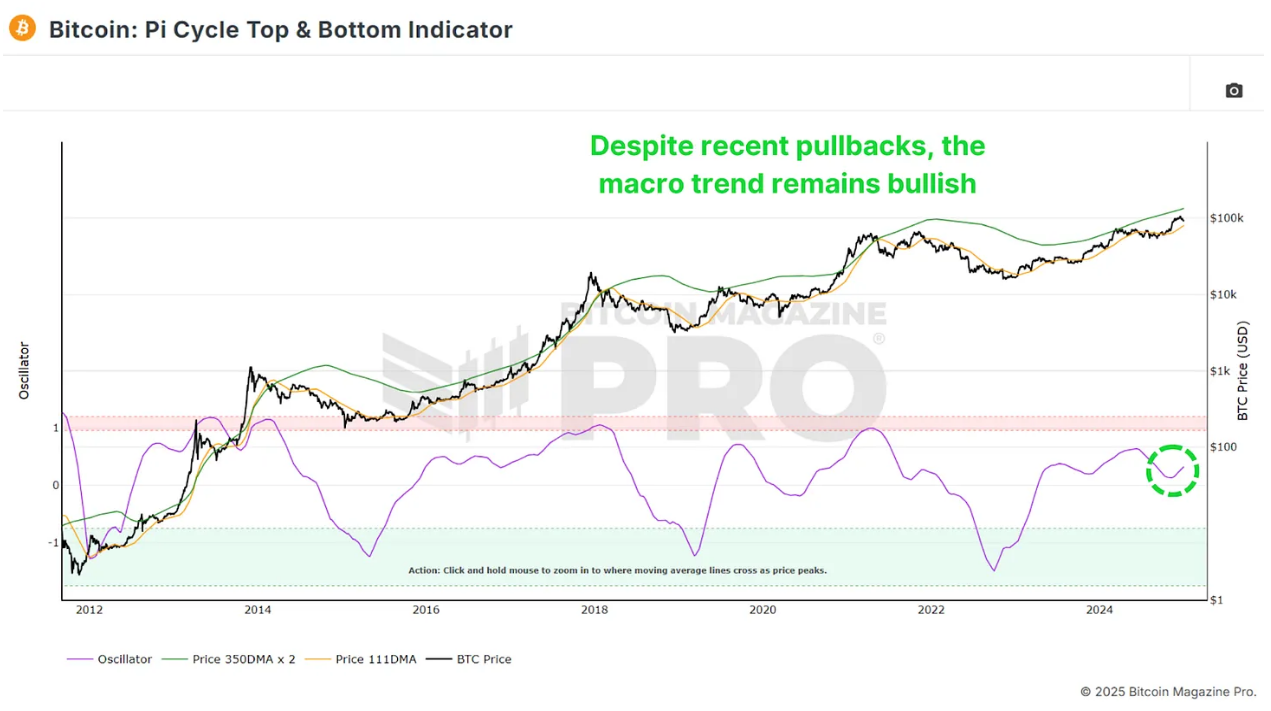
Figure 2: Macro trends remain bullish
The distance between these two moving averages is starting to rise again, indicating that bullish momentum is returning. While 2024 has seen several periods of range-bound consolidation, the current breakout suggests that Bitcoin is entering a stronger growth phase that could last for months.
3. The exponential growth phase of the cycle
Judging from the historical price trend of Bitcoin, the cycle usually lasts for 6 to 12 months in the "post-halving cooling" phase, and then enters the exponential growth phase. Based on past cycle data, we are approaching this breaking point. While returns may be down compared to earlier cycles, we could still see significant gains.
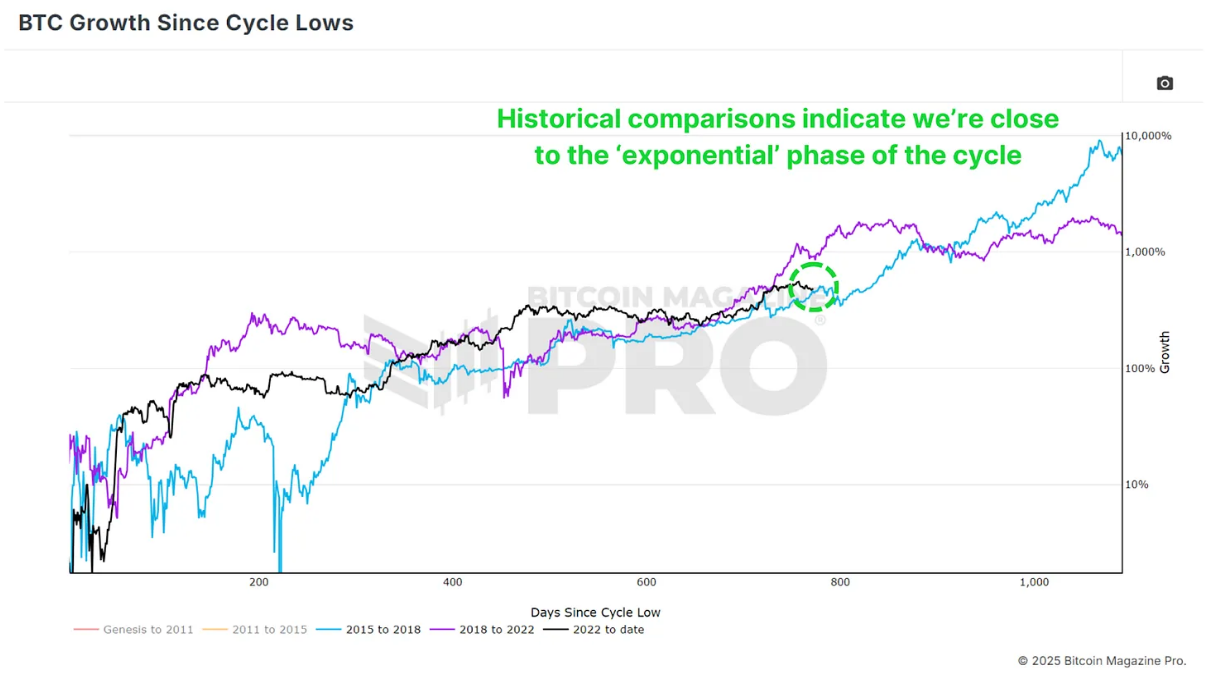
Figure 3: Compared to previous bull cycles, we are approaching the most bullish phase of the cycle
For context, after breaking above the previous all-time high of $20,000 during the 2020 cycle, Bitcoin price peaked at nearly $70,000, a 3.5x increase. If we see a 2x or 3x increase from the conservative estimate of the previous peak of $70,000, Bitcoin could actually reach $140,000 to $210,000 during this cycle.
4. Macro factors supporting Bitcoin’s performance in 2025
Despite facing some headwinds in 2024, Bitcoin remains strong, even as the U.S. dollar index (DXY) strengthens. Historically, Bitcoin and DXY tend to move in opposite directions, so a reversal of strength in DXY could further boost Bitcoin's upside.
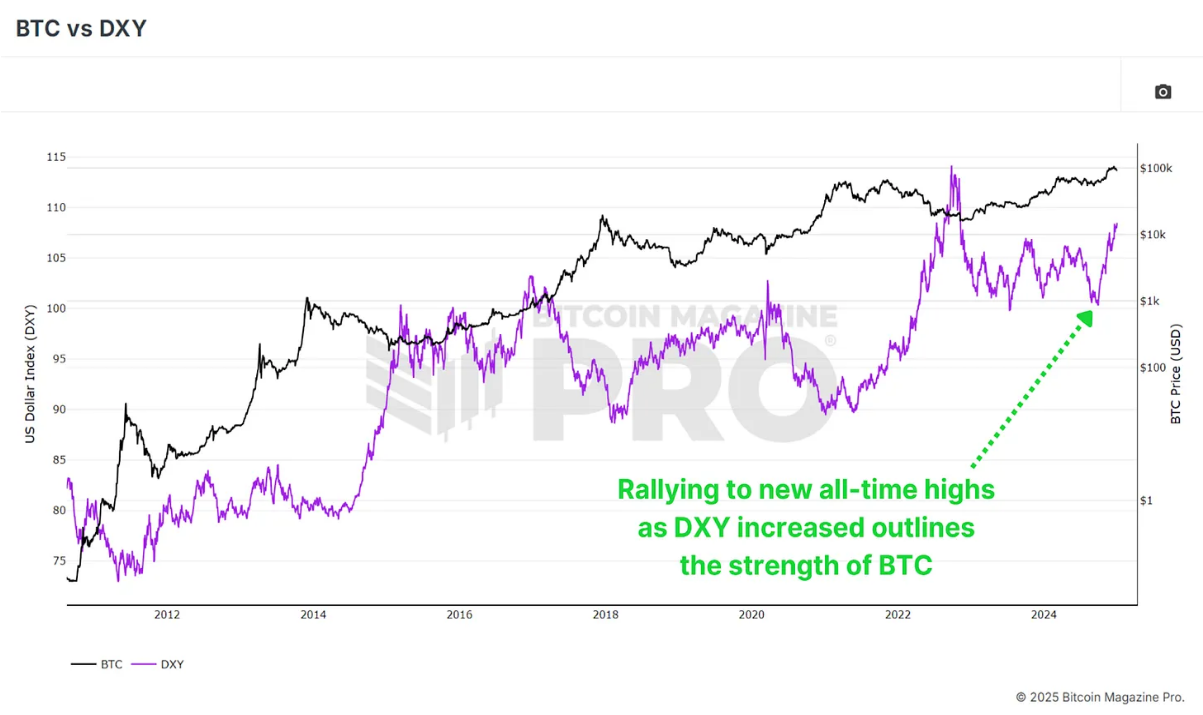
Figure 4: Bitcoin rises even as U.S. dollar index rises sharply
Other macroeconomic indicators, such as the high-yield credit cycle and global M2 money supply, suggest that market conditions for Bitcoin are improving. The money supply contraction seen in 2024 is expected to reverse in 2025, setting the stage for more favorable market conditions.
5. Main cycle chart: There is still a long way to go
The Bitcoin Cycle Master Chart brings together multiple on-chain valuation indicators to show that Bitcoin still has considerable room to grow before reaching overvaluation. Currently, the cap is around $190,000, and this cap continues to rise, further reinforcing the prospect of continued upward momentum.
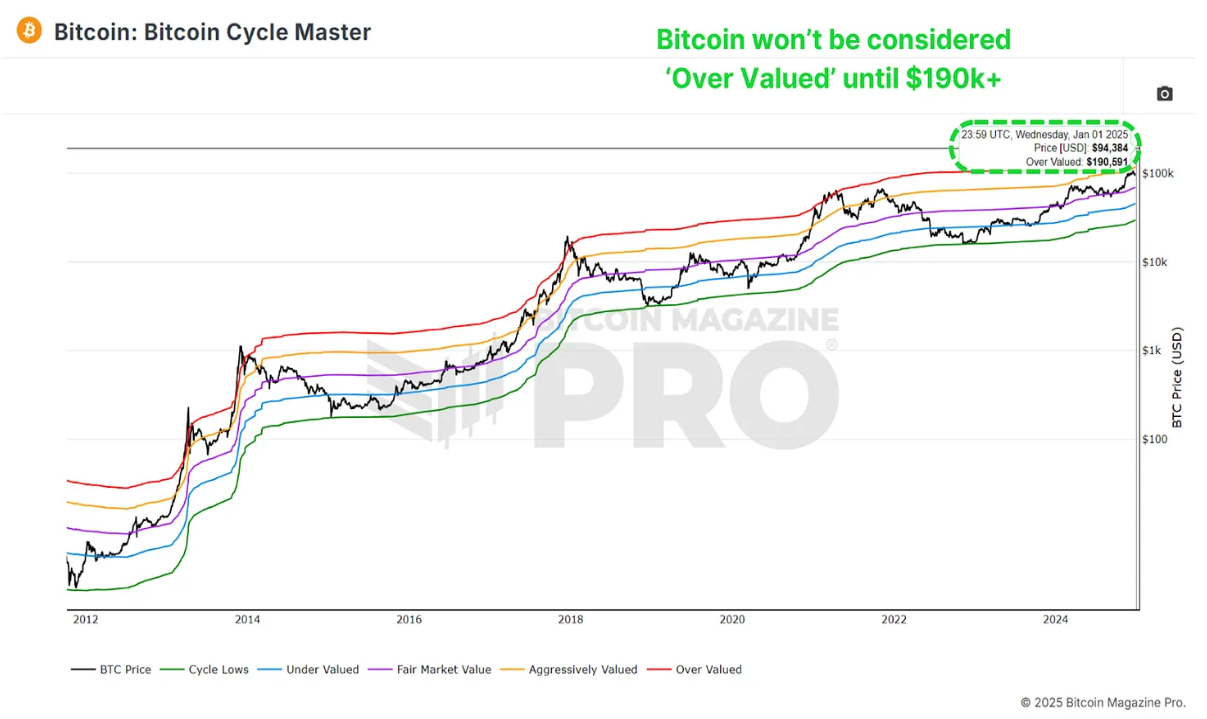
Figure 5: The “overvaluation” level on the main cycle chart has exceeded $190,000
6. Conclusion
Currently, almost all data indicators point to a bullish 2025. As always, past performance is no guarantee of future results, but the data strongly suggests that Bitcoin’s best days may still be ahead, even with 2024 already looking exceptionally positive.


 jinse
jinse