
Has the data on the chain released a peak signal?

Reprinted from jinse
02/17/2025·2MAuthor: Michael Nadeau, The DeFi Report; Translation: Golden Finance xiaozou
In this article, we will focus on the crypto market and through the organic combination of dual analysis frameworks, we aim to provide a more convincing basis for market analysis and judgment.
1. Market sentiment analysis
Native investors in crypto markets remain optimistic about a week after the election and Trump’s inauguration. However, with the president's introduction of memecoin, market liquidity was almost sucked away by this single memecoin, followed by a series of negative events:
-
Statements/commitments related to strategic Bitcoin reserves are considered by the market to lack substantive content
-
"Monday Deepseek/AI panic incident" broke out
-
The "Tariff Panic Weekend" in early February reportedly set the largest liquidation incident in history ($2.2 billion forcibly settling, some estimates higher)
Although Bitcoin has remained relatively stable in the range of $90,000 to $108,000 in the past three months, market sentiment has deteriorated significantly, revealing the impatience, lack of experience and sentiment that is common in the crypto market dominated by retail investors. Characteristics.
From the data we can observe the following phenomenon: Less than a year ago, when the BTC price was $70,000, the market sentiment was in a state of "extreme greed". Now that the price of BTC has reached US$95,000, the market sentiment has turned to "fear". The last time similar sentiment level appeared was in early October last year, when BTC priced at $62,000.
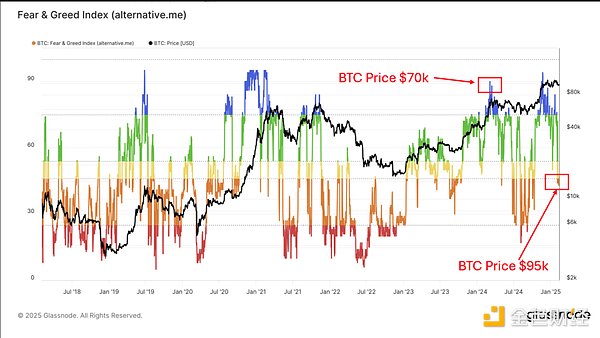
The data below shows the capital rate trend - this indicator measures the position fees longs pay to shorts every 8 hours. This data provides us with an important window for insight into traders' willingness to use leverage, which is an excellent market sentiment and momentum vane.
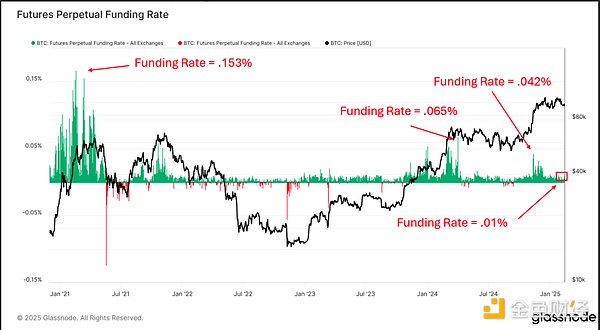
The data display is mutually verified with the trend of the Fear/Greed Index. So, why are investors so panicked?
The main reason is that market funds are mainly concentrated in altcoins and meme coins - these currencies have fallen 50-75% as the Bitcoin-dominated index returns to more than 60%. Just as the market is at a low range, investors are beginning to question whether they can still usher in a real "altcoin season".
*The above data focuses on the top 200 assets by market capitalization, which have a 90-day return rate than Bitcoin.
Anyway, when the market fluctuates, you always want to keep it volatile.
We think this is the right time to consider choosing altcoins again (we will share some popular altcoins later).
2. BTC on-chain data analysis
If you are planning to invest in altcoins, we think you need to have an idea of where Bitcoin is going. This is why we focus on Bitcoin in on-chain data updates.
In this section, we will introduce some of our favorite "period" metrics and share where we are now relative to the peaks of past cycles.
● MVRV - Long-term holders
MVRV (Market Value to Realized Value Ratio) helps us understand the relationship between current market value and the “cost basis” (Achievement Value) of Bitcoin in circulation.
Glassnode calculates the cost basis for all Bitcoins on the network by calculating the latest mobile price for each UTXO on the chain.
It does not take into account Bitcoin in exchanges or ETFs (about 18% of the supply).
In this analysis, we study long-term holders (wallets that did not transfer BTC for at least 155 days) separately from short-term holders (wallets that transferred BTC for within 155 days).
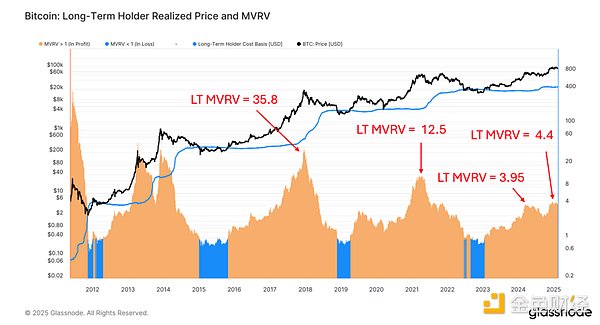
Summary : The MVRV of long-term holders reached a high of 4.4 on December 17, and today it was 3.96. This tells us that on average, long-term holders sit 296% of their earnings. In the previous cycle, this group's increase reached 1150%, and in the 2017 cycle, the increase reached 34,800%.
● MVRV - Short-term holders
It should be noted that short-term holders tend to chase the market. They enter the game later and tend to buy tokens from long-term holders.
summary:
*The MVRV (market value to realized value ratio) for short-term holders is currently 1.06, meaning they are almost at breakeven, compared to 1.45 in March last year.
*Reviewed in the previous cycle, when the market reached its peak, short-term holders had unrealized returns as high as 74%.
*Currently, 20% of the circulating supply is in the hands of short-term holders (16.4% in the same period last year), and this data is not included in the exchange or ETF holdings. It is worth noting that when the market peaked in the last cycle, short-term holders controlled 24% of the supply (there was no ETF at the time). This data is quite revealing, it shows that there is more new capital in the current market than a year ago, and from a percentage point of view, we are gradually approaching the level at the peak of the previous cycle.
● Long-term holder supply
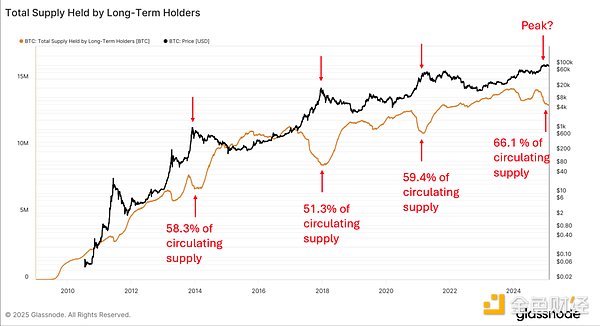
summary:
*At the beginning of this cycle, 73.3% of the tokens in circulation are held by long-term holders. Today, this proportion has dropped to 66.1%, down 7.2%.
*Recalling the previous cycle, at first 67.2% of the supply was controlled by long-term holders. When the market peaked, that percentage dropped to 59.4%, a decrease of 7.8%.
*If following the trend of the previous cycle, data from both short-term and long-term holders indicate that we are currently in the late stages of the cycle.
● Number of BTCs on exchanges
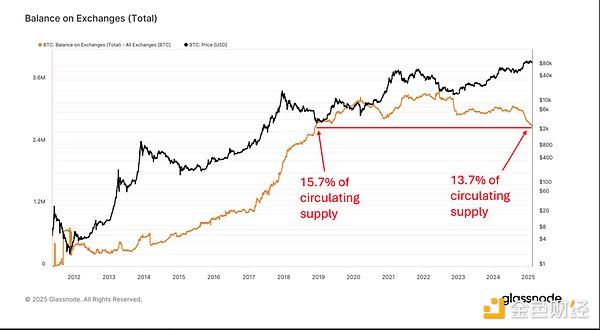
summary:
*There are currently fewer bitcoins on exchanges than at the end of 2018, but today’s market size is much larger – most institutions are now able to buy bitcoins.
*We usually see yellow lines rise at the end of the cycle as investors send their bitcoins back to the exchange to cash out. We haven't seen any strong signs yet. ETFs may have played a role in this regard.
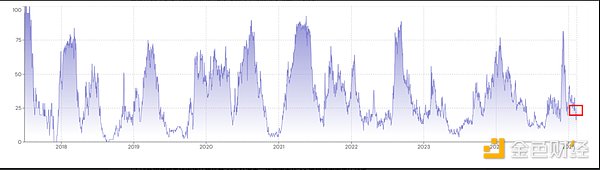
● Pi cycle top indicators
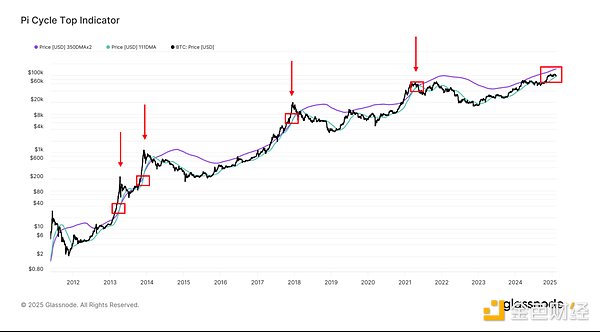
Pi cycle top indicators have traditionally been the exact tool to identify the peaks of the Bitcoin market. It consists of 2 times the 111-day moving average and 350-day moving average.
When the market overheated, the shorter 111-day moving average crosses the longer 350-day moving average.
We can see above that there is still a benign gap between the two moving averages - which shows that the market has not reached an extreme level yet.
● Stable Coin
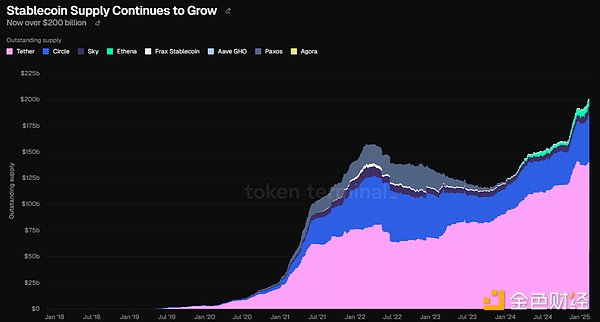
summary:
*Tether's supply grew by more than $20 billion from US presidential election day to the end of the year. It has been stagnant since then (zero growth in the past two months).
*USDC is now the leader (mainly on Solana). It has increased by 22% (over $7 billion) in the past two months.
*We are closely watching the growth of stablecoins as on-chain liquidity is related to crypto prices. A new stablecoin bill (which is probably the first legislation we've seen) could fundamentally change the trend of this chart.
● ETF
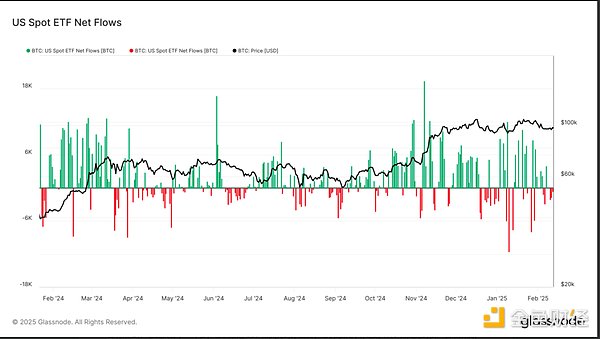
summary:
*The net traffic of Bitcoin has been actually negative over the past two weeks, indicating that investors are taking profits. Nevertheless, ETFs' net capital flow increased by more than $3.6 billion last month. For those curious, ETH etf has increased by $735 million in the past month, surpassing BTC in the past two weeks.
*Bitcoin ETFs have been trading for more than a year and have accumulated nearly $38 billion in net traffic. In total, they hold more than $114 billion in asset management.
*Bitwise's ETF experts will tell you that we are more likely to see more money flowing into ETFs this year than last year. Why? ETFs often have a model where, in the second, third, and other times, capital flows will grow as liquidity generates more liquidity. In addition, there are still large institutions that have not yet received the green light to start allocating Bitcoin.
3. New buyers in the market
In addition to on-chain data, we have to mention that there are several large new buyers in the market. For example:
-
Abu Dhabi sovereign wealth fund Mubadala, which manages more than $1 trillion in assets, recently announced a $436 million investment in Bitcoin.
-
According to VanEck's Matthew Sigel, there are currently 20 state-level Bitcoin reserve bills. If these bills pass, it could drive $23 billion in purchases.
*The abolition of SAB121 means banks can now custody crypto assets.
*New FASB rules state that businesses can now hold Bitcoin on their books at fair value, marking the value they hold as unrealized gains for the first time. Previously, Bitcoin was recorded as an intangible asset and was only impaired.
We haven't even mentioned the strategic bitcoin reserves yet. A newly formed committee plans to make a decision by July. We think other central banks may be taking the lead.
What is the conclusion? Bitcoin is now mature. It has always been trading like a risky asset driven by retail FOMO. This is changing. Investors should have such expectations that if the central bank starts holding this asset, it may turn into a "help-haven" asset, with volatility decreasing over time. We believe we have seen this impact, with ETF buyers bringing more stable demand.
4. Final Thoughts and Portfolio Management
Combining our past and current analyses, we concluded that Bitcoin (and the entire crypto market) still has some room for growth. But that doesn't mean there is no risk. Some on-chain metrics indicate the need for caution. Not to mention, we have seen a lot of "top" behavior in this cycle. At the same time, from the perspective of macro and on-chain data, it is difficult for us to align with a bearish view. Don't forget that the biggest volatility in the crypto market often occurs at the end of the cycle.
As for portfolio management? In this current cycle, we like to adopt a barbell strategy. This means we hold core assets such as BTC, ETH, SOL, and other projects with strong fundamentals (cash flow and repurchase). These include HYPE and Raydium. We also like TIA and SUI as other L1 options. This is one end of the bar (we think it should be more inclined to BTC/ETH/SOL). We then pair these core assets with a small allocation of blue chip meme coins with high beta and sufficient liquidity. The SPX6900, GIGA, PEPE and BONK are our favorites – they all fell more than 50% from their highs as of this writing.

 panewslab