Can BTC overcome the daily bearish divergence? Will it exceed $110,000 this weekend

Reprinted from jinse
05/20/2025·19DAuthor: Biraajmaan Tamuly, CoinTelegraph; Translated by: Deng Tong, Golden Finance
summary
-
Bitcoin’s on-chain data and technical data show that new all-time highs are coming.
-
Glassnode data shows that most Bitcoin wallet users are increasing their holdings of BTC.
-
The bearish divergence in the daily chart indicates a weakening momentum, which has raised questions about whether BTC can rebound to the $120,000 to $130,000 range.
After forming a double bottom pattern on the 1-hour chart, BTC prices rebounded to above $105,000 during the U.S. market trading period.
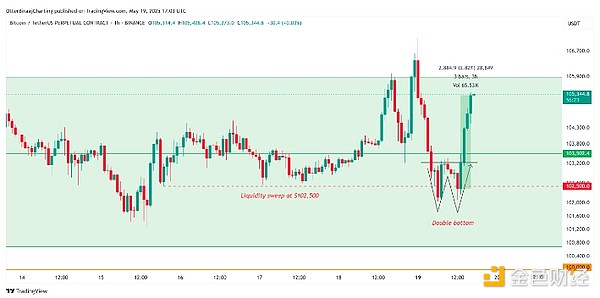
Bitcoin 1 hour chart. Source: Cointelegraph/TradingView
Available liquidity around $102,500 has been swept, which could lay the foundation for a new high for Bitcoin price this week.
Bitcoin fractal hints to hit record highs
Bitcoin’s current range is between $106,300 and $100,600, similar to the previous range between $97,900 and $92,700. The price trend pattern can be summarized into three different situations:
-
Interval lows and interval highs lead to an immediate reversal of the trend.
-
After the range highs ($97,900 and $107,144) formed, a double bottom appeared.
-
The double bottom pattern appears above the range low point, sweeping over the internal liquidity level, but not touching the bottom.
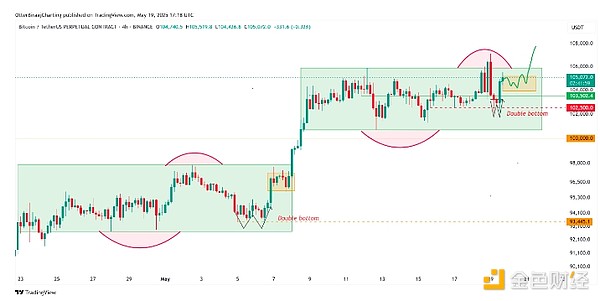
Bitcoin price fractal analysis. Source: Cointelegraph/TradingView
Bitcoin may consolidate between $103,500 and $105,200 (orange box) over the next 24 hours, which is exactly the same as the previous sideways between $95,800 and $97,300. If this pattern continues, the possibility of Bitcoin breaking through $107,000 may increase, and it is possible that it may even break through $110,000 this week, a new high.
Conversely, failure to hold $103,500 could result in a retest of the $102,000 support level. This will be seen as a price fractal failure and could fall below $102,000 in the coming days, hitting a new low.
Can Bitcoin overcome the daily bearish divergence?
Glassnode reveals a significant shift in Bitcoin investor behavior, with the latest cumulative trend score chart showing small holders holding less than 1 BTC joining the bullish trend with a score of 0.55. Large holders holding 100-1,000 BTC and 1,000-10,000 BTC showed strong cumulative scores, 0.9 and 0.85, respectively.
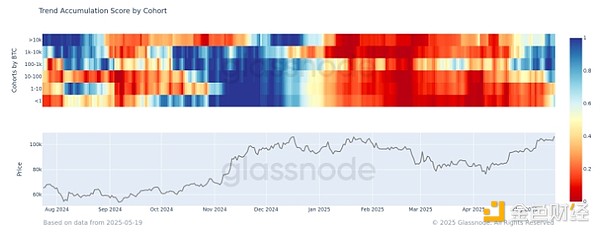
Bitcoin accumulation trend score. Source: Glassnode
Only 1-10 BTC's holdings remain are still scattered. The transition from blue (dispersed) to red (absorbing), suggests that market confidence is increasing. Historically, this trend has often preceded the rise in BTC prices.
However, cryptocurrency analyst Bluntz pointed out that a bearish divergence appeared on the daily chart, which could dispel hopes of BTC reaching an all- time high this week. The bearish divergence occurs when prices are forming higher highs, but the Relative Strength Index (RSI) indicator is forming higher lows, which means that as prices soar, buying pressure begins to weaken.
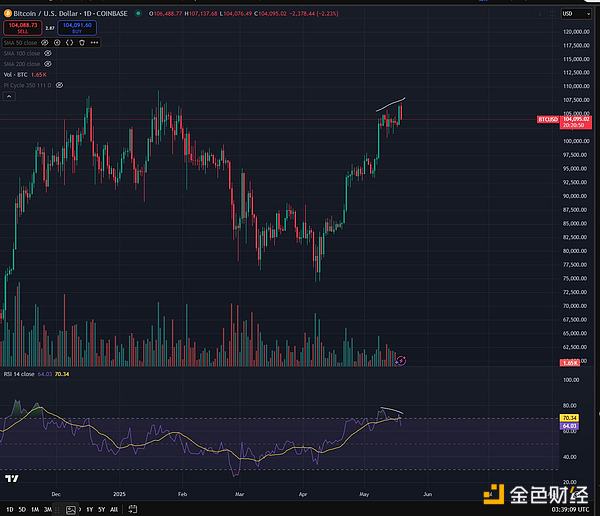
Bluntz Capital's Bitcoin bearish divergence. Source: X.com
Similarly, Bitcoin analyst Matthew Hyland pointed out that if bulls want to maintain control, they need to push up prices in the coming weeks. "BTC is now at a critical moment and may need to rise to $120,000 to $130,000 in the coming weeks to get the RSI indicator to a higher high and avoid any confirmation of weekly bearish divergence," said Hyland.