
Bitcoin fell by $80,000 again, where is the bottom?

Reprinted from panewslab
03/11/2025·2MOriginal title: "The market plummeted, Bitcoin fell by 80,000 yuan again. US dollars, is the bear market coming?"
Original author: Luke, Mars Finance
introduction
The cryptocurrency market is in turmoil. Yesterday, on March 9, Bitcoin, the weather vane of the crypto world, plummeted 7%, and the price fell from its highs, triggering widespread panic in the market. According to The Block data, the centralized exchange (CEX) spot market transaction volume reached US$1.77 trillion in February, although it was a new low this year, but it fell 23.7% from US$2.32 trillion in January, indicating a significant shrinkage in market activity. Meanwhile, crypto analyst Miles Deutscher pointed out on social media that only 12 of the top 100 crypto tokens with market caps have achieved positive returns in the past 90 days. For example, BERA soared by 579.63%, TRUMP rose by 85.61%, while Bitcoin fell by 13.47%, and LINK fell by 40%. This drastic differentiation and the decline in trading volume together outline a picture of extremely panic in the market. So, does this mean that a bear market has quietly arrived?
Market sentiment and panic index
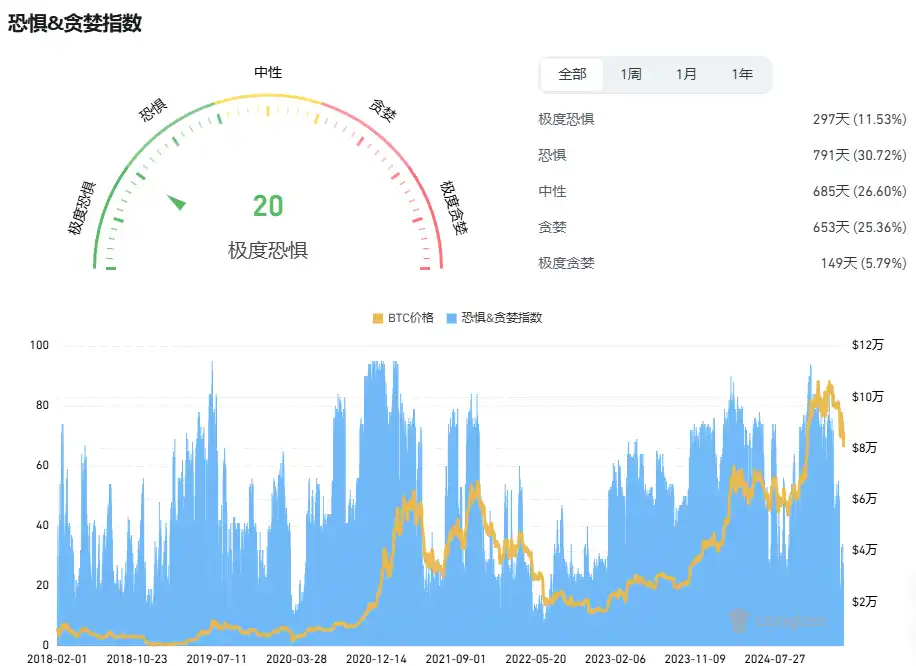
Market sentiment is one of the important indicators for judging trends, and the liquidated stock data, as a direct reflection of market sentiment, provides a key supplement to this analysis. At present, the cryptocurrency Fear & Greed Index has fallen to 35, in the "fear" range, which has fallen sharply from 70 ("extreme greed") a month ago. This index combines factors such as volatility (25%), market trading volume (25%), social media sentiment (15%), questionnaire (15%), Bitcoin dominance (10%) and trends (10%), clearly reflecting the rapid deterioration of investor confidence. Glassnode's net unrealized profit/loss (NUPL) indicator further confirms this trend, falling from 0.6 (high greed) to 0.2, close to the early stages of a historical bear market, usually below 0 marking the market's entry into a surrender phase, and the current values indicate that although the market has not yet completely collapsed, panic is approaching the critical point.
CryptoQuant data shows that demand growth in the Bitcoin spot market is slowing down, and the proportion of short positions in Open Interest in the futures market has increased significantly. As of March 9, CME Bitcoin futures short positions accounted for 45% of the total positions, up 15 percentage points from 30% at the beginning of February. This short-dominated trend has aggravated market panic, and investors' expectations of price decline have increased. Some people even discussed whether Bitcoin will fall below the psychological threshold of $60,000.
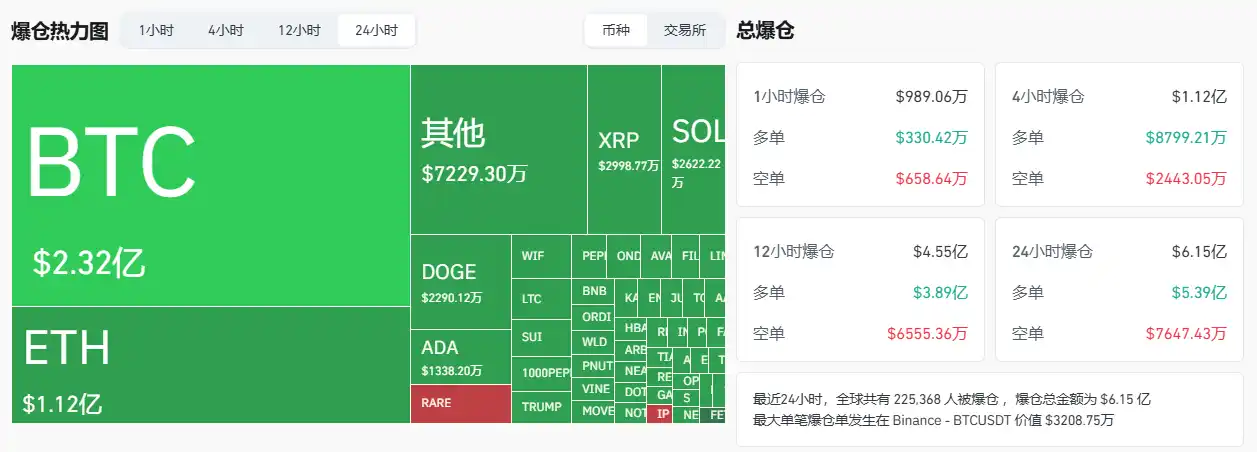
The liquidation data further reveals market dynamics. In the past 1 hour, the amount of BTC liquidation reached US$4.7072 million, the ETH was US$1.3061 million, and the total amount was US$11.5482 million, of which the long liquidation was US$8.2925 million and the short liquidation was US$24.3301 million. The short liquidation far exceeds the long liquidation may trigger a "short squeeze" and lead to a short-term rebound; in the past 24 hours, the total liquidation amount reached US$616 million, the long liquidation was US$540 million, and the short liquidation was US$76.3075 million. The long liquidation dominated reflects the continued pressure in the bear market, which is consistent with the deterioration of NUPL and the rise of short positions. Short-term fluctuations and long-term risks coexist. Investors need to be vigilant about complexity, pay attention to short squeeze opportunities while preventing downward risks in the bear market.
Technical analysis: Key support and resistance
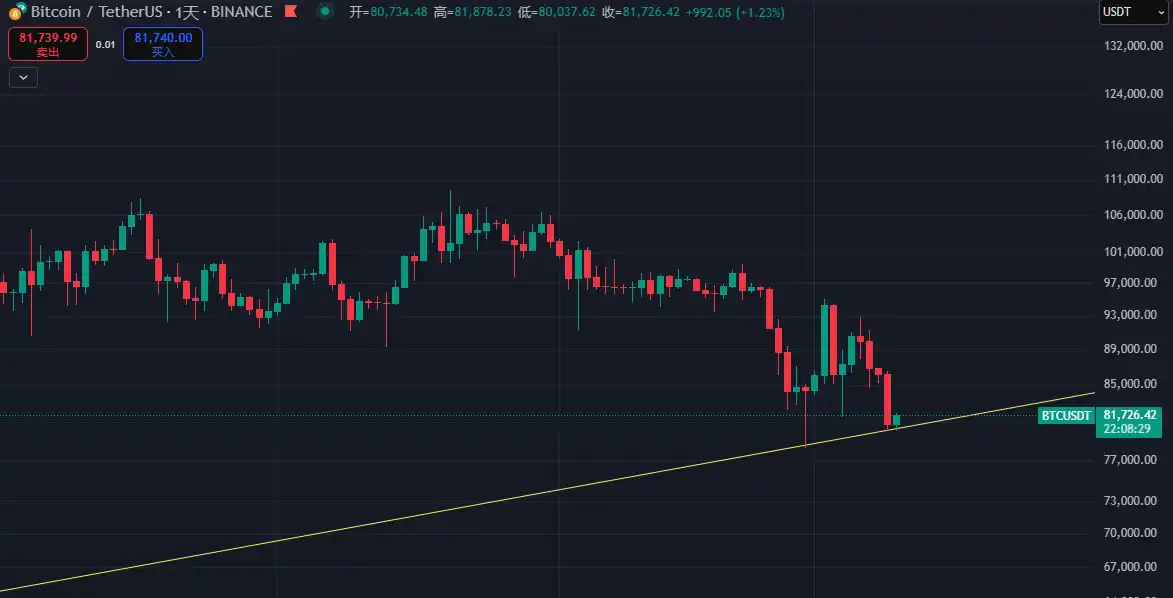
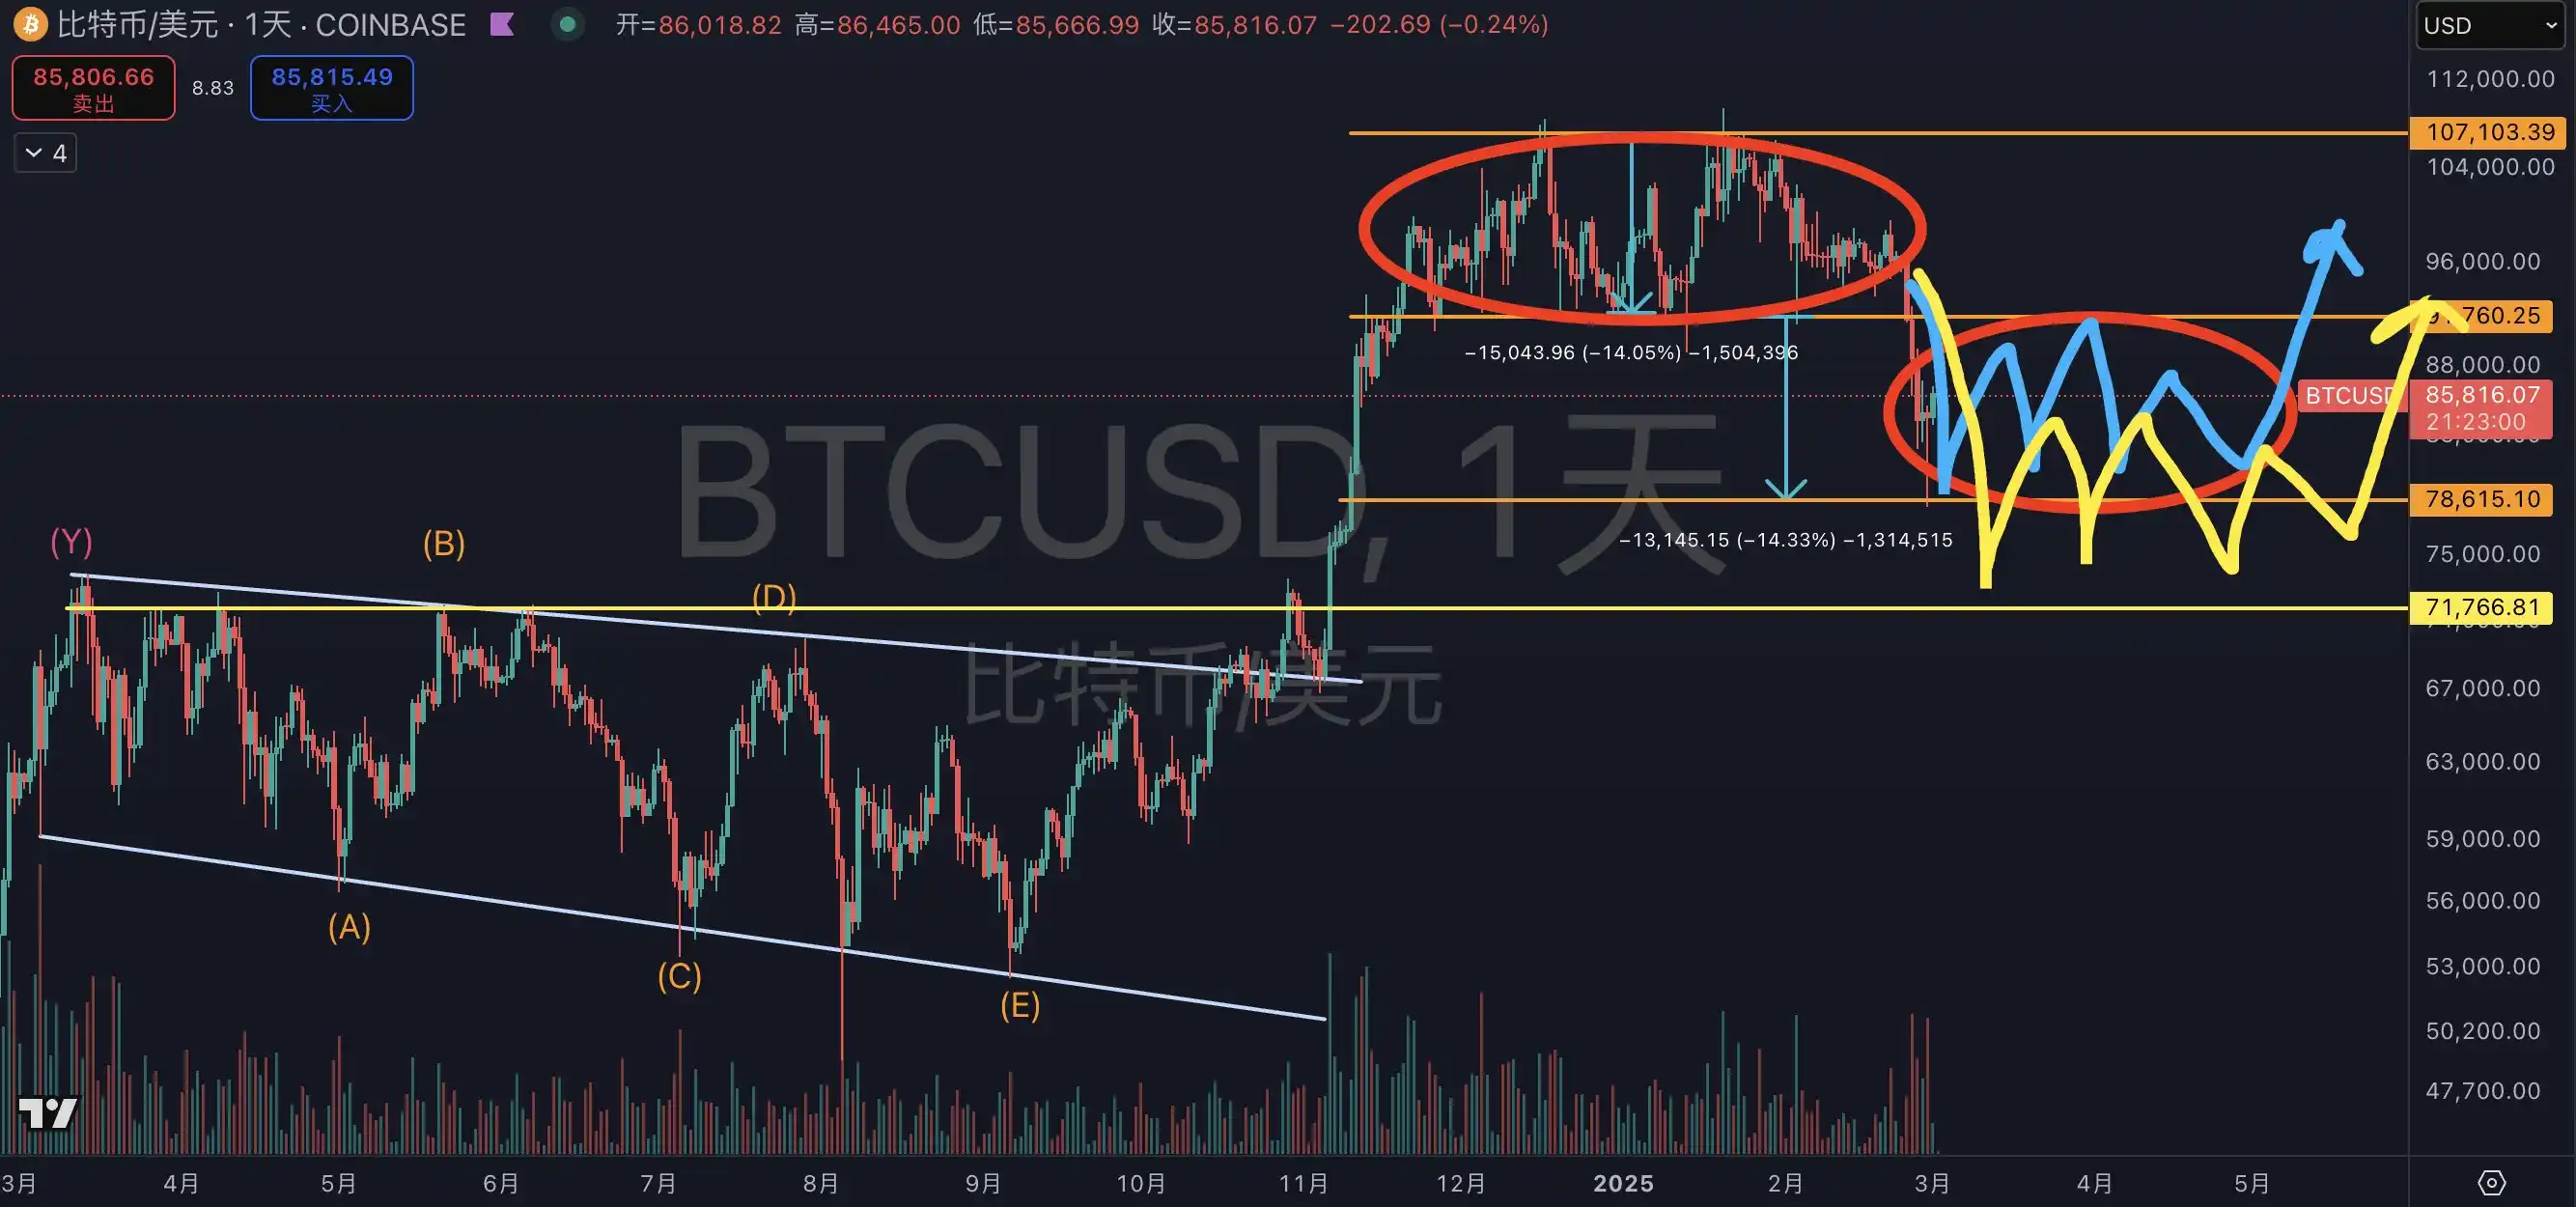
From a technical point of view, Bitcoin price is at a critical juncture. After the high fluctuations from November 20, 2024 to February 24, 2025, the price forms a potential double-top pattern—a typical bearish signal. After the double top neckline fell below, the price fell from its highest point of $82,000 to around $76,000, and the amplitude was close to the expected target (about 10%), but the time dimension was not fully digested.
Analysts generally believe that the market may face two paths:
· Path 1: If time exchanges space, if $78,000 becomes the bottom, both bulls and bears need to wait patiently for two or three months to confirm the trend. Currently, the range between the 50-day moving average (approximately $77,500) and the 200-day moving average (approximately $72,000) has become the focus of short-term game. If the price can maintain $78,000, it may form a W-bottom pattern, laying the foundation for subsequent rebounds.
· Path 2: Further downward If the bears dominate, the price may fall to the left-side trading-intensive zone of $70,000-$72,000. This area is not only the support level of the 200-day moving average, but also an important level of retracement after the rebound of the low in August 2024. "I'm not in a hurry to participate in the bidding transaction at the current price, $75,000 is the only level I'm interested in," trader Eugene Ng Ah Sio said in the Telegram group. This cautious attitude reflects the uncertainty of the market.
In addition, the Relative Strength Index (RSI) is currently 42, which has fallen from the overbought zone (above 70) to a neutral low level, suggesting that short-term selling pressure has eased, but has not yet entered the oversold zone (below 30). Technical analysis recommends that investors stay on the verge of waiting and watching, avoid blindly chasing highs or buying at the bottom, and wait for the trend to be clear.
Macroeconomic background: good news and uncertainty
The impact of macroeconomic factors on the cryptocurrency market cannot be ignored. First, changes in the global interest rate environment are putting pressure on high-risk assets. The yield on the 10-year U.S. Treasury bond has recently risen to 4.2%, up 40 basis points from 3.8% at the beginning of the year, attracting funds to return from the crypto market to traditional safe-haven assets. Meanwhile, inflation expectations remain high and the Fed may delay interest rate cuts, further undermining Bitcoin’s attractiveness as a “digital gold.”
At the legislative level, the weakening of good news has also exacerbated market pressure. Take Utah’s Bitcoin bill as an example, which was passed in the state Senate with 19 votes in favor and 7 votes against, and will soon be signed into law by the governor. However, its core clause—allowing Utah to hold Bitcoin as a reserve asset—was removed in the final consideration. The original terms would authorize the state Treasury Secretary to invest in Bitcoin, capping it at 5% of its market capitalization (about $25 billion), which would have made Utah the first state in the United States to have Bitcoin reserves. Today, the bill only retains basic rights such as custody protection and Bitcoin mining and node operation, and its influence is greatly reduced.
The full outlook of macro positives has frustrated market confidence, and external uncertainties (such as the potential adjustments to crypto policies by the Trump administration) are also adding variables to the market. Bloomberg analysts predict that if Trump is re-elected, his tax cuts and regulatory relaxation may boost the crypto market in the short term, but the long-term effect still needs to be observed.
ETF Outflow: Institutional enthusiasm declines
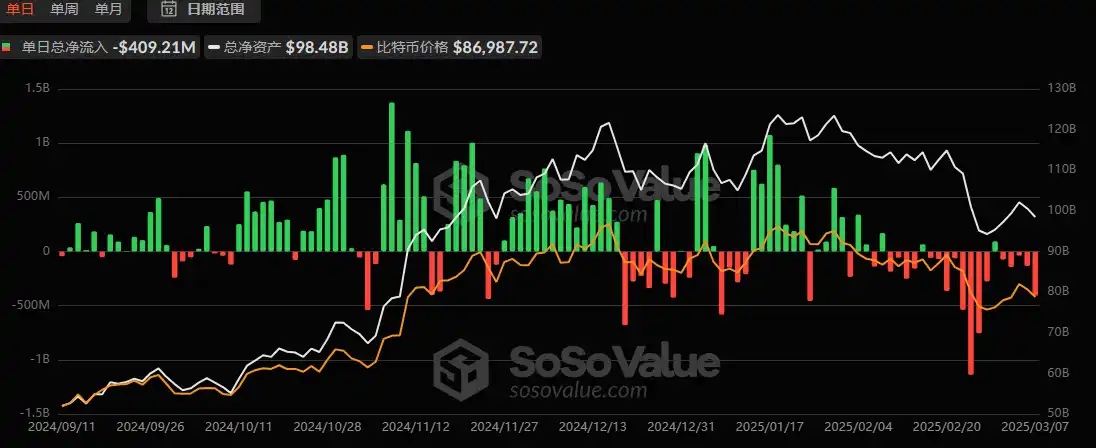
Institutional demand was once an important driving force for the rise in Bitcoin prices in 2024, but the recent outflow of capital from spot ETFs is worrying. According to sosovalue data, the net outflow of Bitcoin spot ETFs in the United States has exceeded US$500 million since March, with GBTC outflows from Grayscale being particularly significant. "Bitcoin spot demand growth is shrinking, while short positions in the futures market dominate," said Julio Moreno, head of research at CryptoQuant.
Jacob King, founder of WhaleWire, said bluntly: "The Bitcoin bear market has arrived. ETF capital outflows have reached a record, institutional demand narrative collapses, and Bitcoin is heading towards a multi-year low." Although this view is more extreme, ETF outflows do reflect the decline in institutional enthusiasm. At the beginning of 2024, the average daily net inflow of ETFs was as high as US$200 million, but now it has turned into net outflows, indicating that institutional investors are reevaluating the risk-to-return ratio of crypto assets. This change further hit market confidence.
On-chain data: hope coexist with uncertainty
On-chain data provides a glimmer of hope for the market. According to Glassnode's analysis, long-term holders (investors who hold positions for more than one year) are changing their behavior, from distribution to accumulation. As of March 9, the net position change of long-term holders (Net Position Change) turned positive, with an average daily inflow of about 5,000 bitcoins. Historically, this trend shift has often been a reliable signal of the market moving from the top to the bottom, such as the bottom formation period in early 2019 and March 2020.
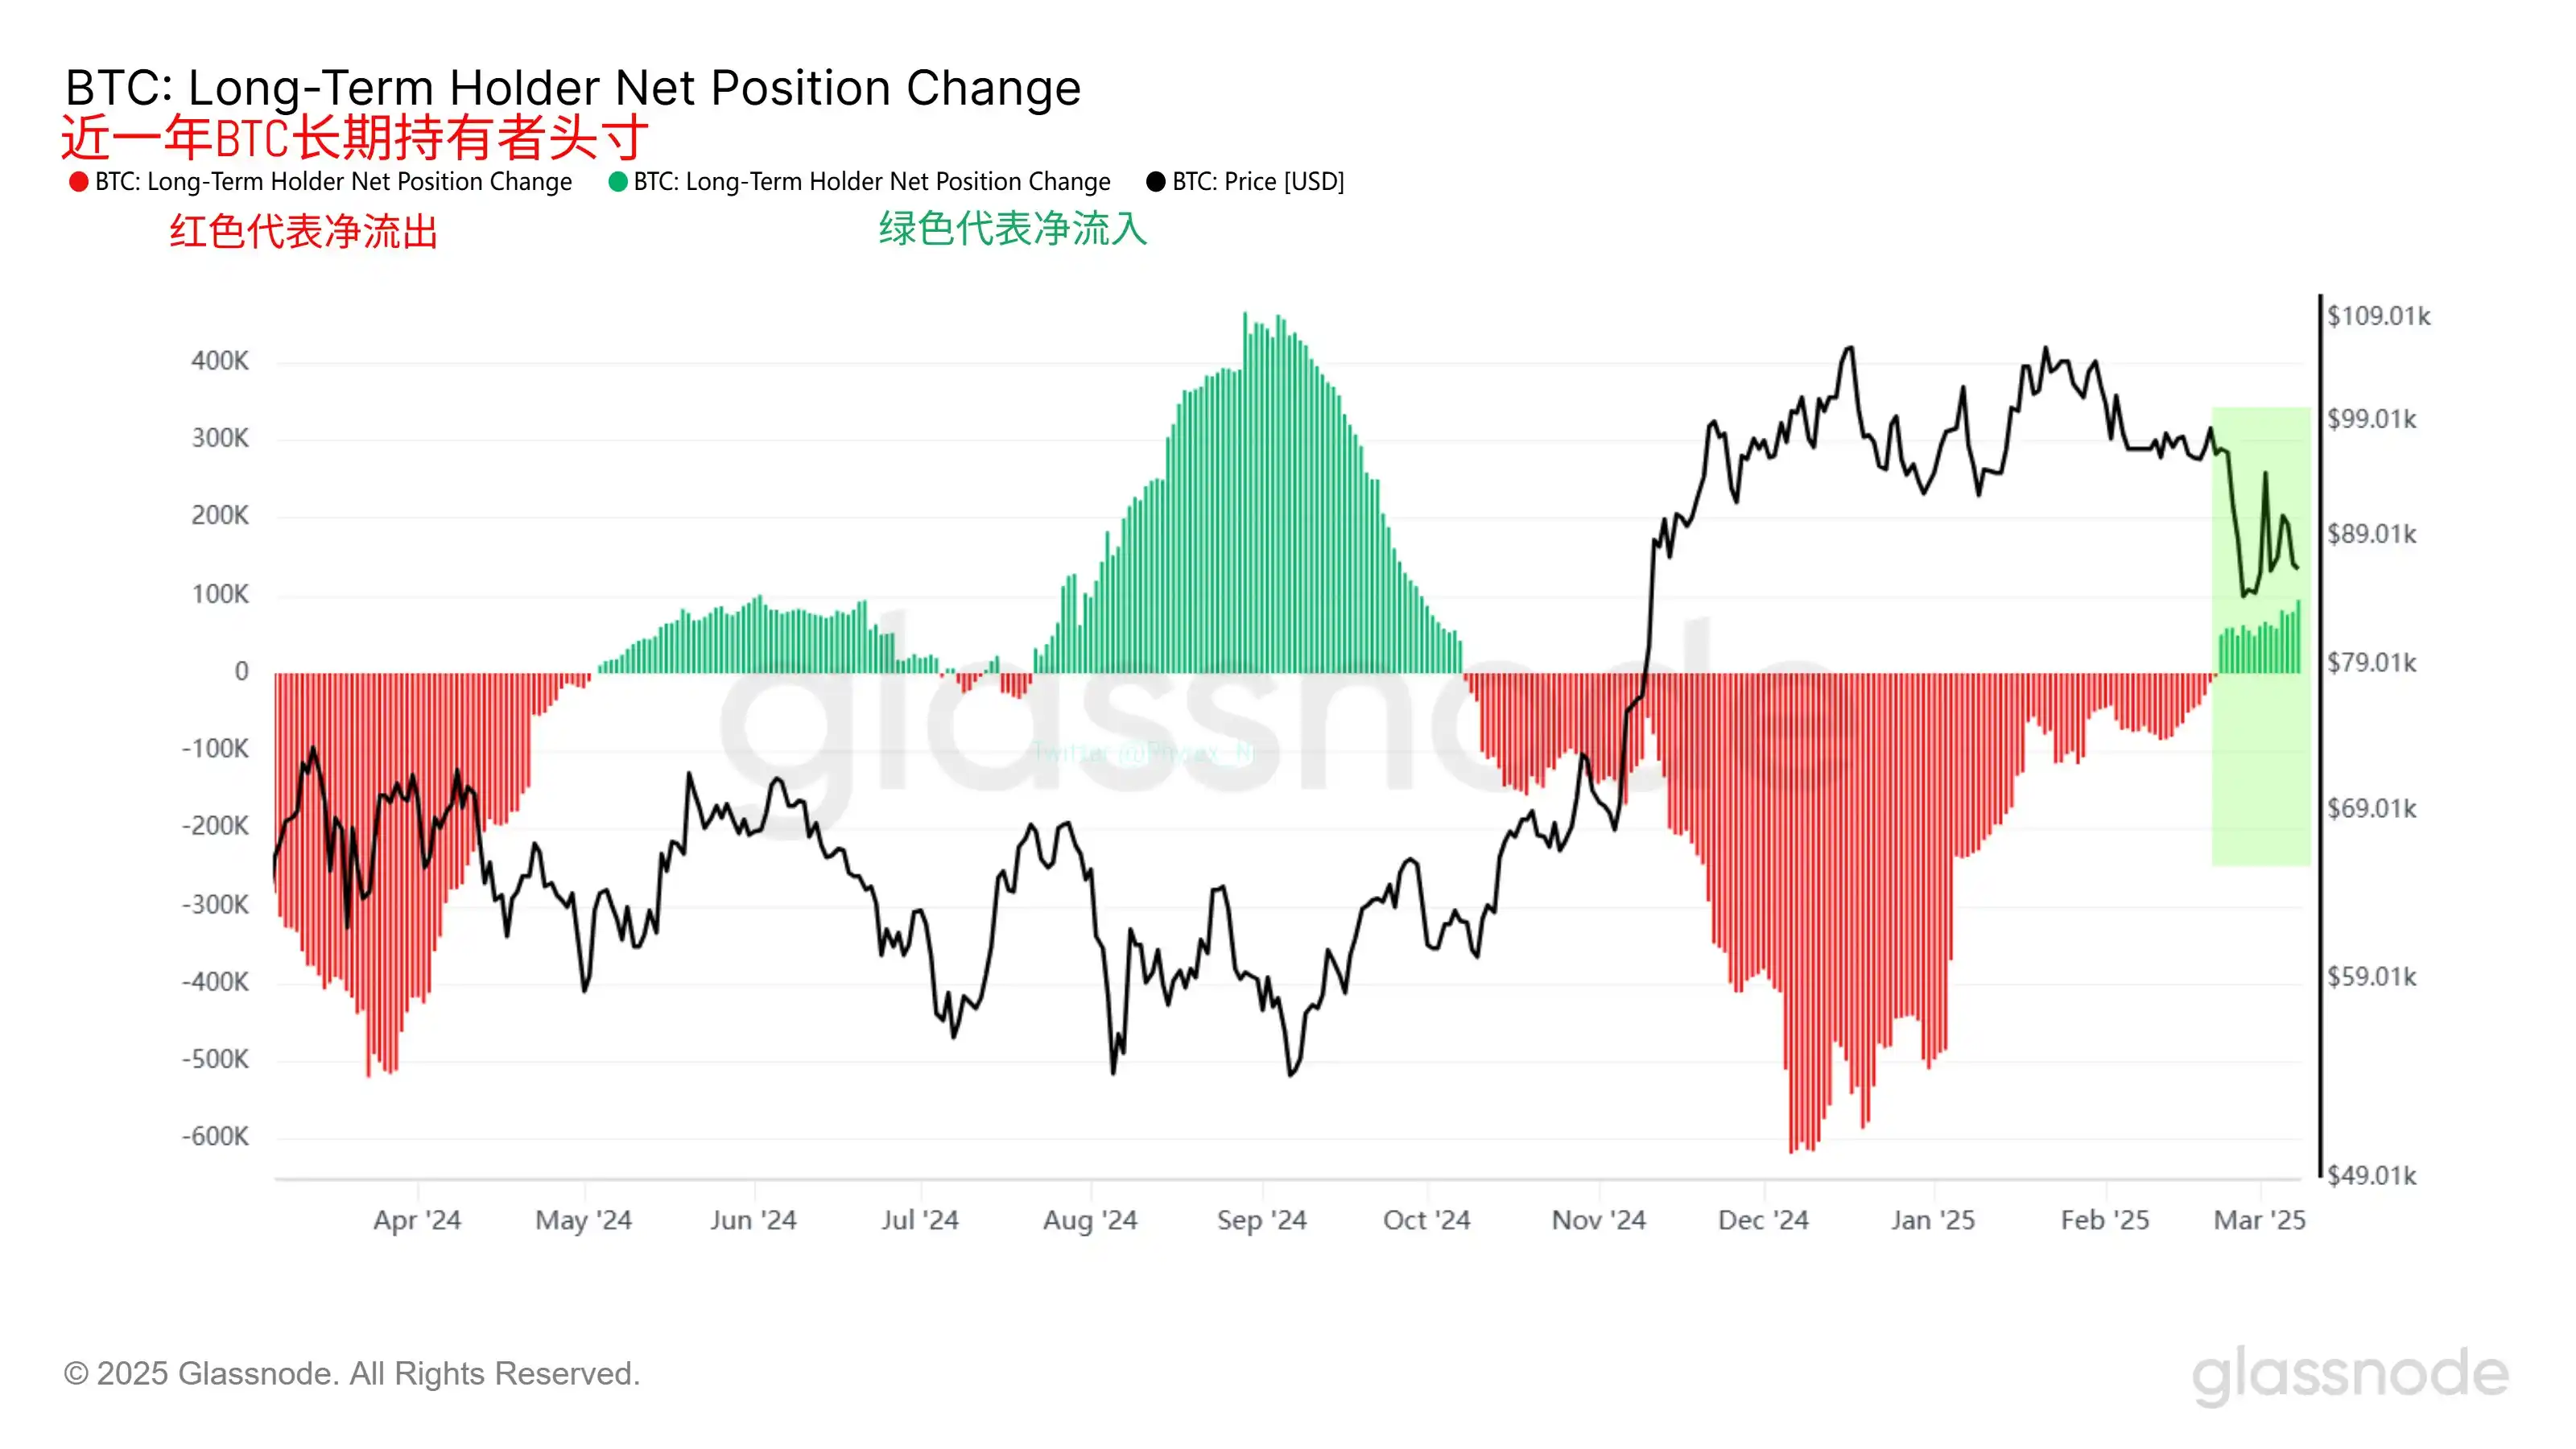
However, the current situation is different from previous cycles. First, the price decline can be slow and persistent, and it is only possible to hit a relative bottom if long-term holders reach new highs (for example, more than 700,000). Second, the rise of spot ETFs has changed the holder structure. According to Arkham Intelligence data, ETF holders currently control about 4% of Bitcoin circulation supply (about 840,000), while the proportion of long-term holders on the traditional chain has dropped from 65% in 2023 to 60%. This may weaken the predictive power of traditional on-chain metrics.
Although it is exciting to switch to a buy model for long-term holders, it is still in the early stages of inflows and the possibility of a reversal has not been ruled out. Market bottom forecasts still need to be verified in combination with more external signals.
Historical comparison: Similarities and similarities in bear markets
Looking back on history, the current market has similarities with the 2018 and 2022 bear markets, but there are also significant differences. In 2018, Bitcoin fell from $20,000 to $3,200, a drop of more than 80%, accompanied by the ICO bubble bursting and trading volume shrinking; in 2022, it fell from $69,000 to $16,000, a drop of about 76%, affected by the FTX crash and interest rate hikes. Currently, Bitcoin has fallen by about 7%-13% from its high of $82,000, which is far from reaching the historical bear market level.
The similarities are the decline in trading volume and market differentiation. For example, CEX transactions fell 70% from its peak in 2018, while currently only 23.7%. The difference is institutional participation and the emergence of ETFs, which provides a new buffering mechanism for the market. Therefore, the current panic may be a period of adjustment rather than a full-scale bear market, but if ETF outflows continue to expand, historical tragedies may repeat themselves.
Whether the market has entered a bear market is still uncertain. The technical side shows that the risk of a pullback is still there, and key support levels such as $78,000 and $75,000 are being tested; at the macro level, favorability is limited, ETF outflows intensify, and institutional narrative weakens; although the on-chain data implies that long-term holders' confidence has rebounded, the bottom is not yet clear. The current panic may be a precursor to deeper adjustments or the darkness before dawn.
For investors, caution is the best. As Miles Deutscher said, "This is a rotating market, and the coin holders are being punished." Instead of chasing short-term fluctuations, it is better to pay attention to the intersection of technical support, macro dynamics and on-chain signals. Learn from Warren Buffett's wisdom - "Greed when others are afraid, and fear when others are greedy" - in the stormy waves of the crypto market, risk management and long-term perspective are the ways to survive.


 jinse
jinse