Artificial economic recession: wind direction and revelation in cycle alternating

Reprinted from panewslab
03/15/2025·3MAuthor: Doug O'Laughlin
Compiled by: Deep Tide TechFlow
Sorry, I've disappeared for a while recently. I just finished moving to New York City and was also facing some health issues. One thing I want to tell you about is: I will start a week off on March 27 to recover after outpatient surgery. But now let's get to the point.
Markets are rapidly adjusting pricing based on the upcoming recession, partly due to policies from the Trump administration and significant pressure on the dollar. I will give a casual summary from a macroeconomic perspective and discuss the semiconductor industry and areas of interest to me. Let's start from a macro perspective and then go into in-depth discussion.
"Artificially created" recession and 10-year Treasury yield
Recent comments show that the current government places more emphasis on 10-year Treasury yields than focusing on stock market levels - a different from past strategies like the so-called "Trump Protection". The “adjustment period” was mentioned several times in an interview with Fox News, which shows that the government’s focus has shifted from stock market performance to bond market signals.
The main indicator to measure this is the 10-year Treasury yield. The 10-year Treasury yield is the borrowing rate paid by the U.S. government, and by reducing this key interest rate, it can improve the affordability of housing or the ability of consumers to buy cars. However, “operating” the 10-year Treasury yield is not as direct as adjusting interest rates. Interest rate adjustments are mainly based on the overnight bank lending rate determined by the Federal Reserve, while the price of 10-year Treasury bonds is a market-driven price determined by auctioning investors willing to buy government bonds.
The problem is: 10-year Treasury yields are not an accurate science. No one really knows how the 10-year Treasury bond fluctuates, its price is determined by transactions and is believed to reflect inflation and real GDP growth of the bond-issuing countries.
This brings challenges. Tariffs could trigger inflationary pressures in the short term, and if the 10-year Treasury yield drops to 3% (as some, such as Bessent predicts), this could reflect a downward revision of real growth expectations. In this case, the market may view the recession as a necessary adjustment.
This is what the market expects at present. This is the yield curve a month ago and now. Specifically, the short end of the curve begins to fall. This means that the market is rapidly pricing lower short-term rates and lower federal funds rates. In this case, this may not be a sign of a decline in inflation, but a reflection of weak economics and market perception that the Fed's interest rate cut is not fast enough.
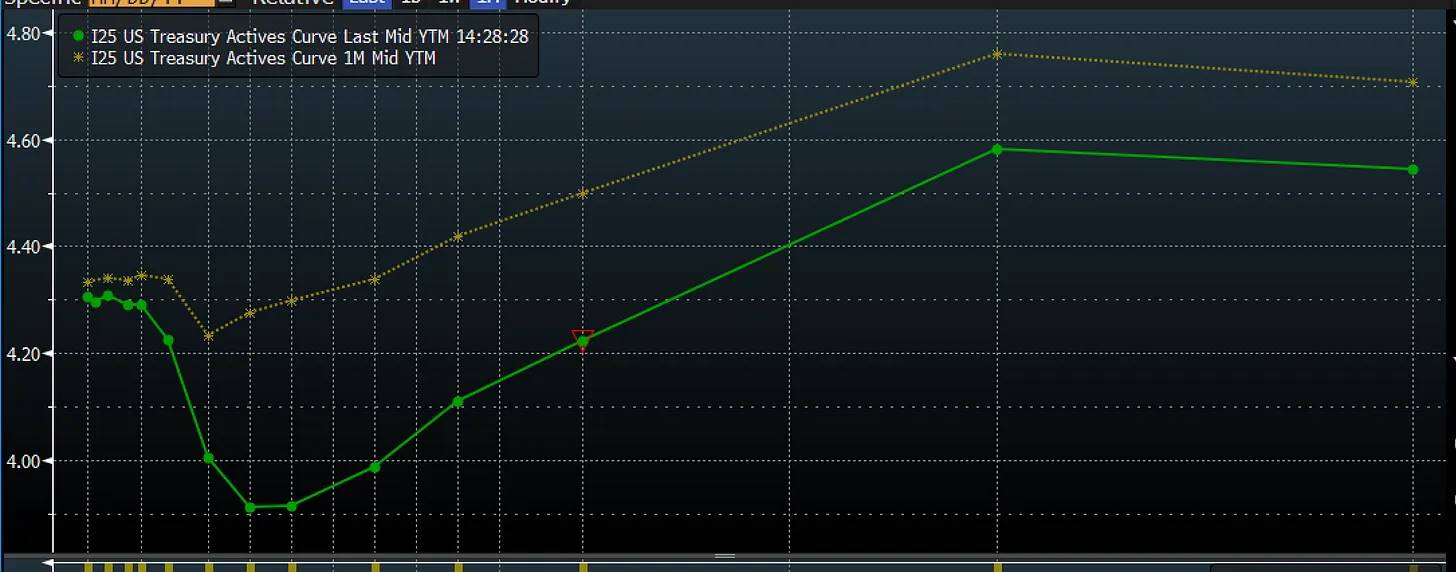
Source: Bloomberg
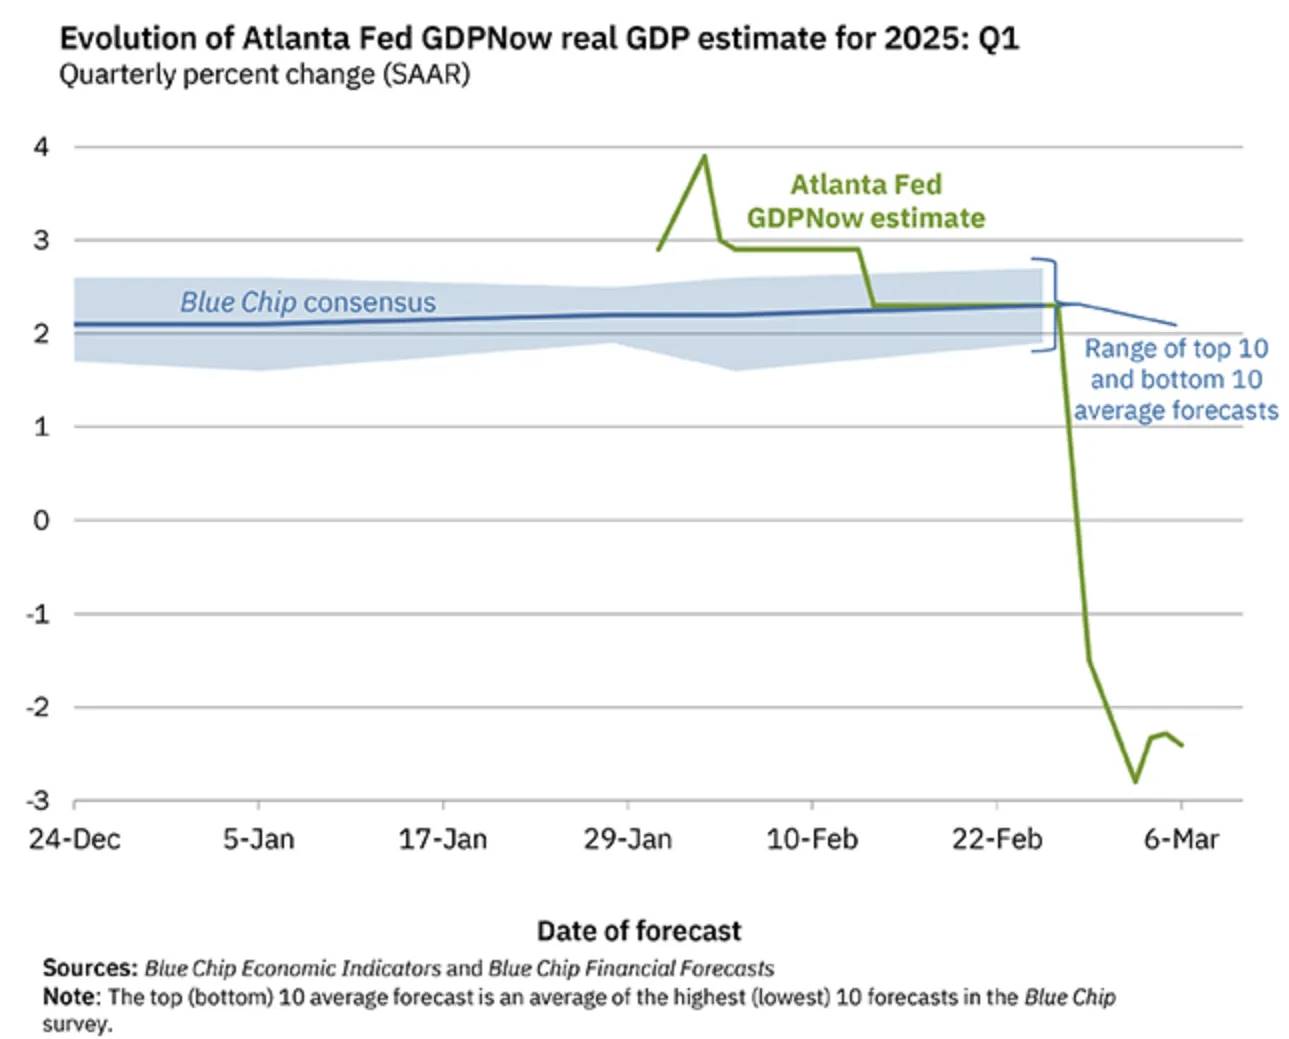
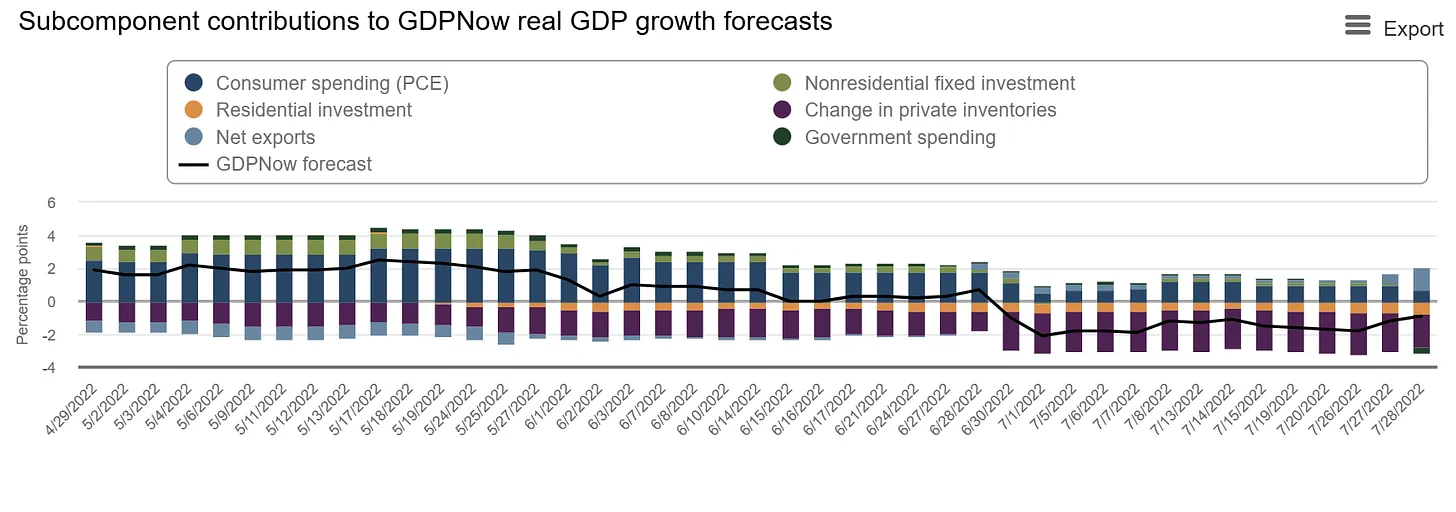
We are going through it all in real time. GDPNow, a real-time economic forecasting tool, now predicts that the economy will shrink significantly in the first quarter, with technical reasons behind this, but the overall trend is still weakening.
One important factor is the impact of net imports on GDP calculations. Net imports are deducted in GDP calculations, which part is an early response to tariffs. But under this appearance, the economy is weakening across the board. The above figure shows the trend of growth contribution and its estimates. Imports dragged a lot, but more importantly, the rate of change in most other categories is also deteriorating.
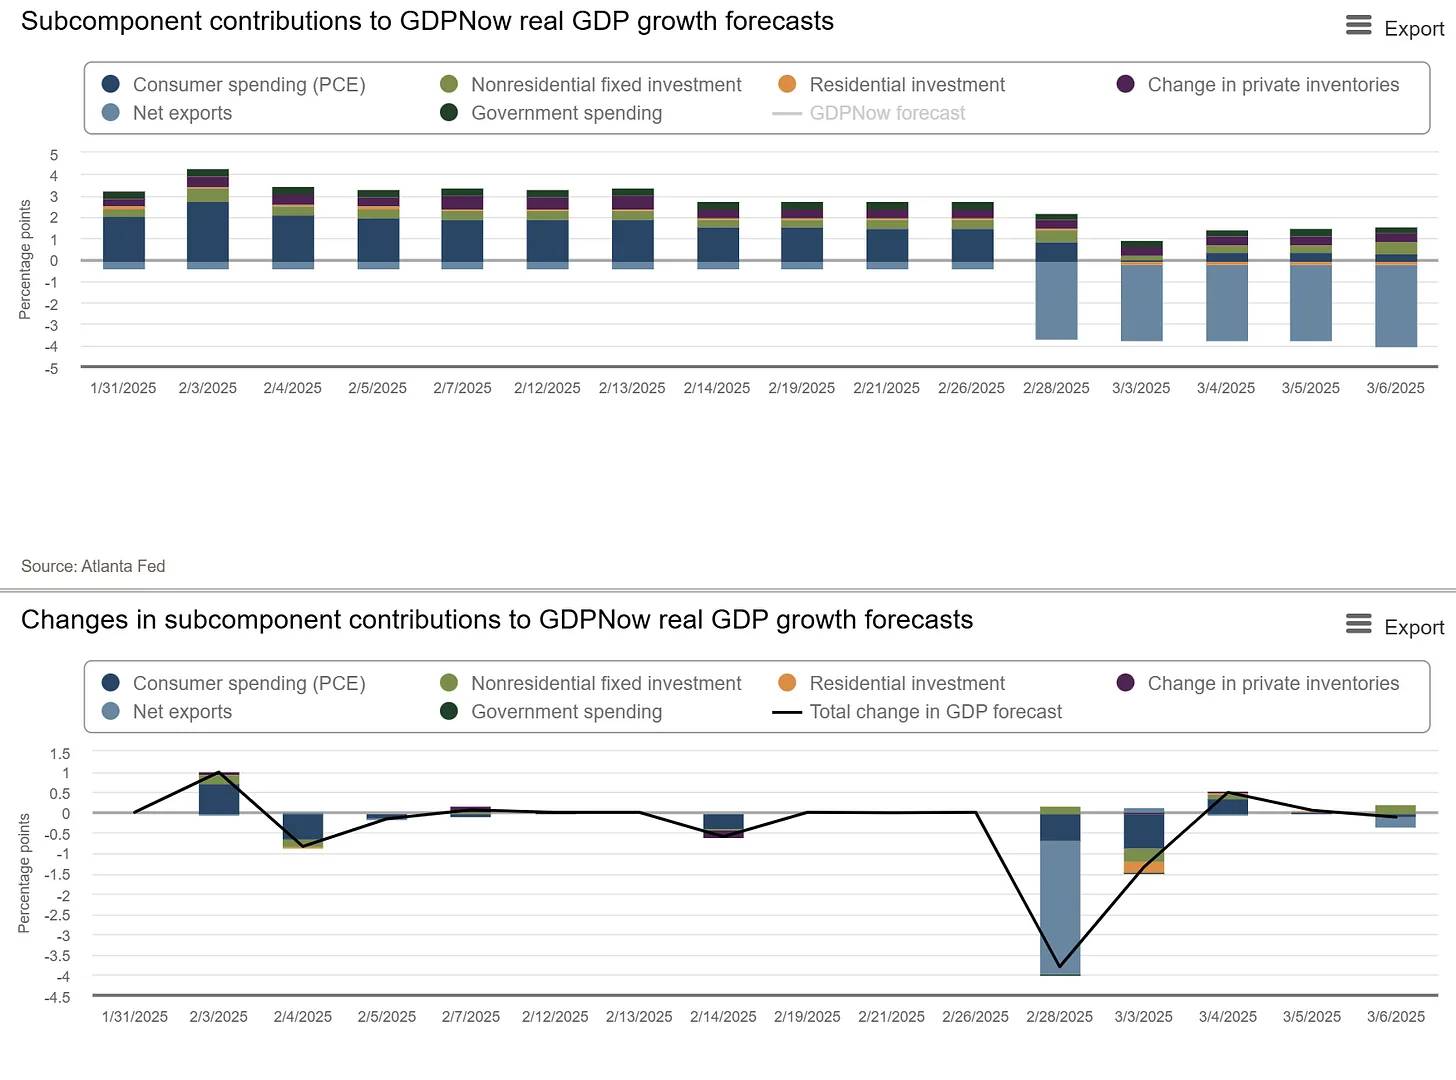
Source: GDPNow
The second chart further shows weakness in imports, while residential investment, government spending (expected) and consumer spending are also weakening. Similar to the economic contraction period in the second quarter of 2022, the rate of change is deteriorating sharply. Here is a chart of growth contributions in 2022, when the economy was hit by a sharp decline in inventory.
This situation will quickly reverse with the normalization of inventory. So, will this tariff advance effect recover quickly like inventory adjustments after the epidemic (one-time) or will it lead to a spiral decline in consumer and business confidence?
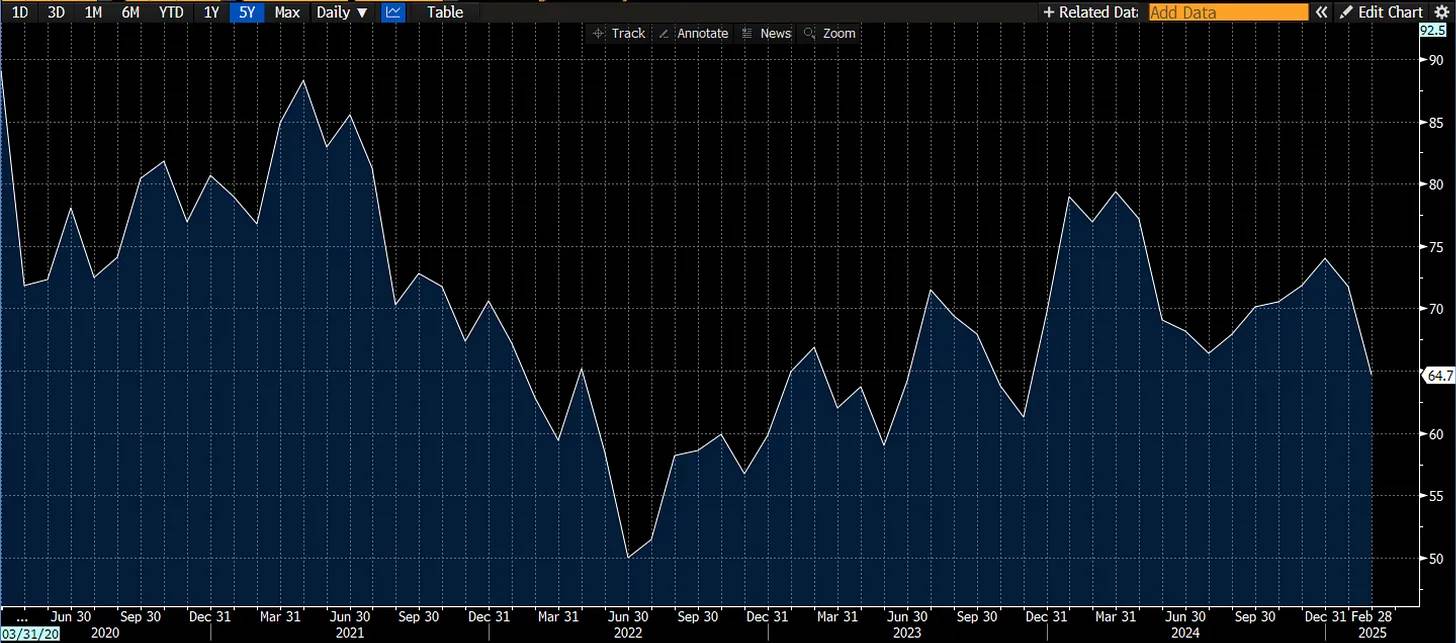
The problem is that consumer confidence is starting to decline, and some leading indicators such as the Consumer Confidence Index and the Leading Economic Index are also starting to decline. Worryingly, this decline is accelerating. Most economic indicators and consumption data appear to point to further weakness and uncertainty.
The yield curve shows signs of economic weakness, a decline in consumer confidence and a potential for a technical recession as imports surge. Expectations of weak economics can have a reflexive effect, as seeing weak economics prompts people to increase their savings. Trump now uses the term “transition period”, but this statement does not usually bode well in the market.
The timing is very subtle. The yield curve has just returned to normal, and this is almost always the beginning of pain. When the curve becomes steep, a callback or recession begins. In other words, the inverted yield curve usually indicates a recession; and when the yield curve returns to normal, the recession and the impact on the stock market begins. What we are seeing now is that the yield curve reversed at the end of September last year.
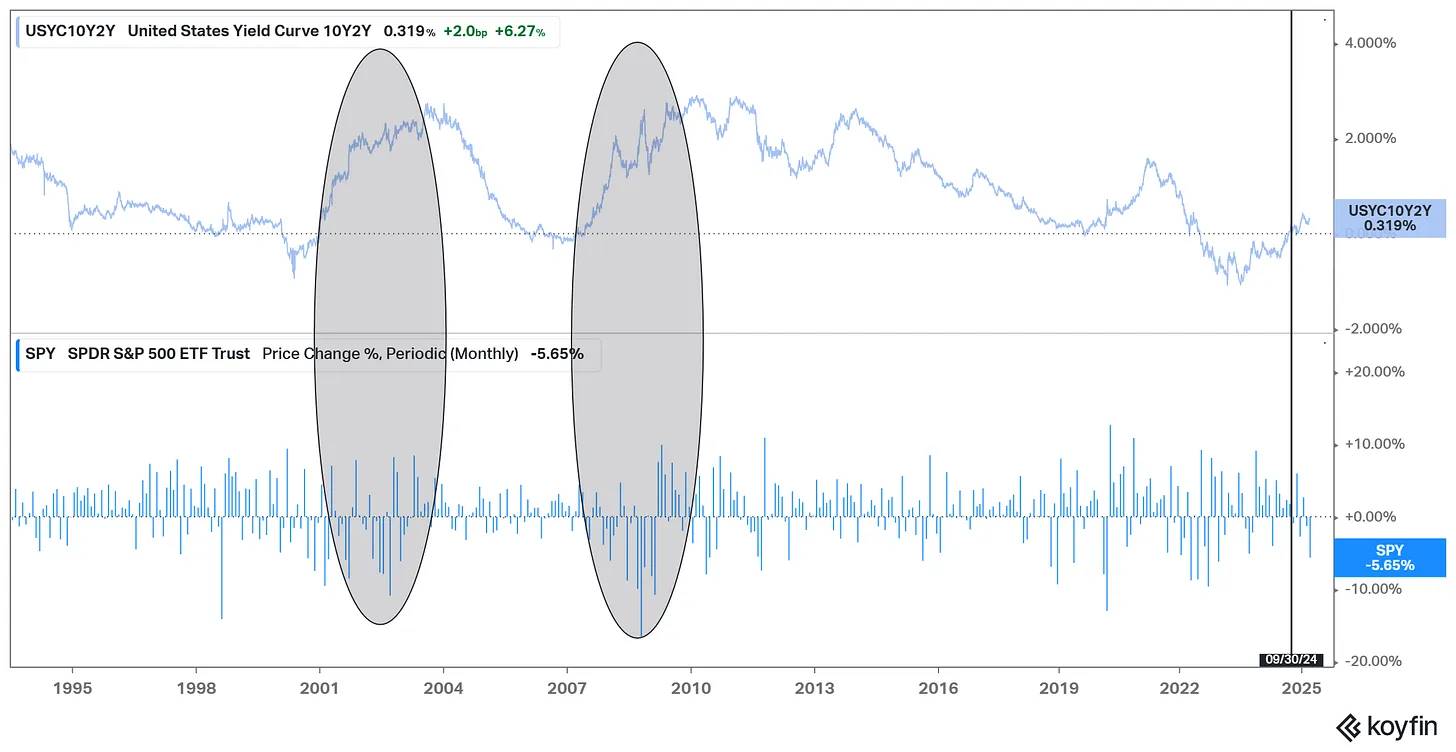
Source: Koyfin
We are experiencing pain now. Another key factor is tariffs and uncertainty, because in economics, uncertainty is almost synonymous with volatility. When we cannot determine whether the tariff rate is 10%, 20%, or 25%, decisions become more difficult. However, an overwhelming theme is trade.
Trade deficit and asset flows
The United States has a long-term huge trade deficit, which means more imports than exports. However, these dollars do not disappear out of thin air; they are transferred to foreign entities as payments for goods and services. These foreign exchange funds are usually returned to the U.S. financial markets through investment. In this way, the trade deficit is accompanied by capital inflows, providing funding for the purchase of U.S. assets.
This forms a natural driving force to buy U.S. assets with the dollar accumulated by the trade deficit. It can be regarded as a natural inflow of US dollars brought about by trade.
However, Trump's policy explicitly focuses on trade through tariffs. Tariffs will naturally push up consumer prices, reduce trade, and reduce trade deficits when tariffs are high enough. This reduces the US dollar returning to the United States, which in turn has a more adverse impact on asset prices -capital outflows.
Raising tariffs could mean a decrease in dollars accumulated by foreign entities, which are already the largest buyers of U.S. assets. For example, a large Japanese conglomerate with a trade surplus with the United States will reduce its purchases of assets, including U.S. Treasury bonds, due to reduced business. Given that the main auction portion of U.S. Treasury bonds are now facing outflows, while 24% of Treasury bonds are held by foreign investors, this will reduce foreign investors' purchasing demand, pushing up 10-year Treasury yields. This is a very tricky situation.
The United States continues to raise tariffs and adopts a negative attitude towards global trade, which will lead to a natural outflow of assets and prompt some foreign entities to choose to escape U.S. assets. After decades of trade deficit, this mechanism may be automatically implemented and seriously out of control. The trade deficit has long existed as a natural source of capital inflows. The following chart of the proportion of the US global market capitalization has been repeatedly discussed - now there seems to be a way to prevent inflows of funds, that is, tariffs.
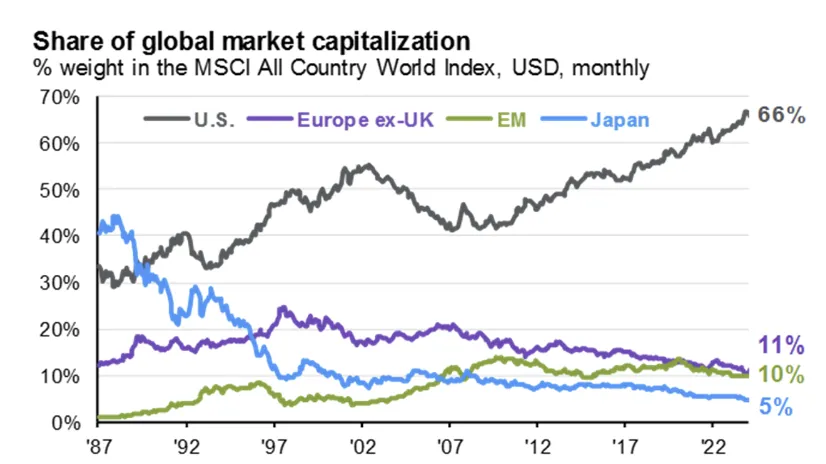
Source: JPMorgan Market Guide
Another uncertainty factor is that the “Western” is no longer so united. The Financial Times is questioning the Transatlantic Partnership. It is one thing to keep assets in the financial markets of allies, but it would be completely different if you are no longer a strong ally. With the United States evacuating and implementing reciprocal tariffs similar to the Smut-Hawley Act (essentially unilateral tariffs that eventually evolved into a bilateral tariff war with Canada), it is hard to say whether their allies remain strong.
The division of trade is the division of alliances. And as this continues, assets will flee. A retaliatory U.S. government could push European trade to China, the world's largest manufacturing base. The past world order is at risk, and betting all the chips in the US basket seems no longer a wise strategy. So, where will the assets flow? By far, Europe seems to be the biggest beneficiary.
The reversal of European and American characters
An ironic pattern is that the United States and the European Union are strangely swapping roles. Driven by a large number of AI investment announcements and new potential defense spending plans, Europe is doing something that has been overlooked for a long time – deficit spending.
At the same time, it can be said that increasing revenue by raising tariffs while significantly reducing costs is the definition of austerity policy. This is exactly the strategy Europe has adopted after the financial crisis, and roles are now swapping. The record of austerity is terrible, while deficit spending has created the U.S. economic dominance and differentiation after the financial crisis.
This can partly explain why assets are beginning to flow out, and the biggest differentiation of assets in developed countries is flowing to Europe. The huge money that used to flow to the United States is now reversing, first flowing to large liquid assets or markets in similar languages in the short term. One way to represent this trend is the ratio of IEV (European ETF) to S&P 500 ETF. In 2025, the trend of relatively excellent performance in the United States was broken, and the trend of capital flowing to Europe became significant.
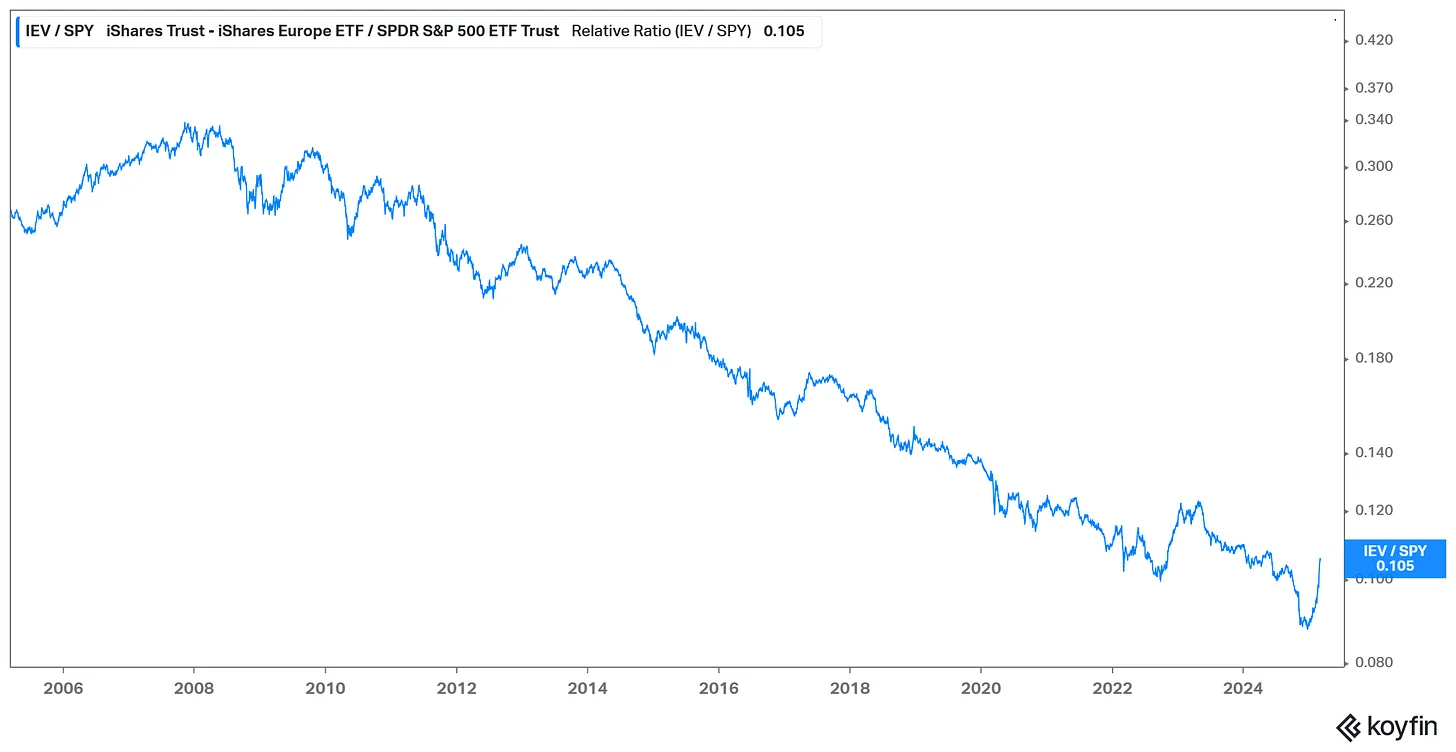
This will be a long-term trend as a large number of American exceptional deals are disintegrating. Another accelerated this trend is the rapid decline in US asset prices, while the rest of the world performs relatively well.
But to be honest - this is a communication about semiconductors, not macroeconomics. Most of the dynamics mentioned here are basically relatively consistent macroeconomic perspectives and are being quickly priced by the market. The reality is that significant changes in the market take time and are quickly approaching the final result. This can be a drastic process.
Market dynamics and semiconductors
Finally, let’s go back to the semiconductor industry I love. I want to make some observations. First of all, the market peak is reminiscent of the decline in most markets. There is an old proverb that the semiconductor industry leads the market, and according to my observation experience, this sentence is indeed valid.
The chart below illustrates that when the semiconductor sector stops its relatively strong performance, the market often experiences a significant pullback in the next few months.
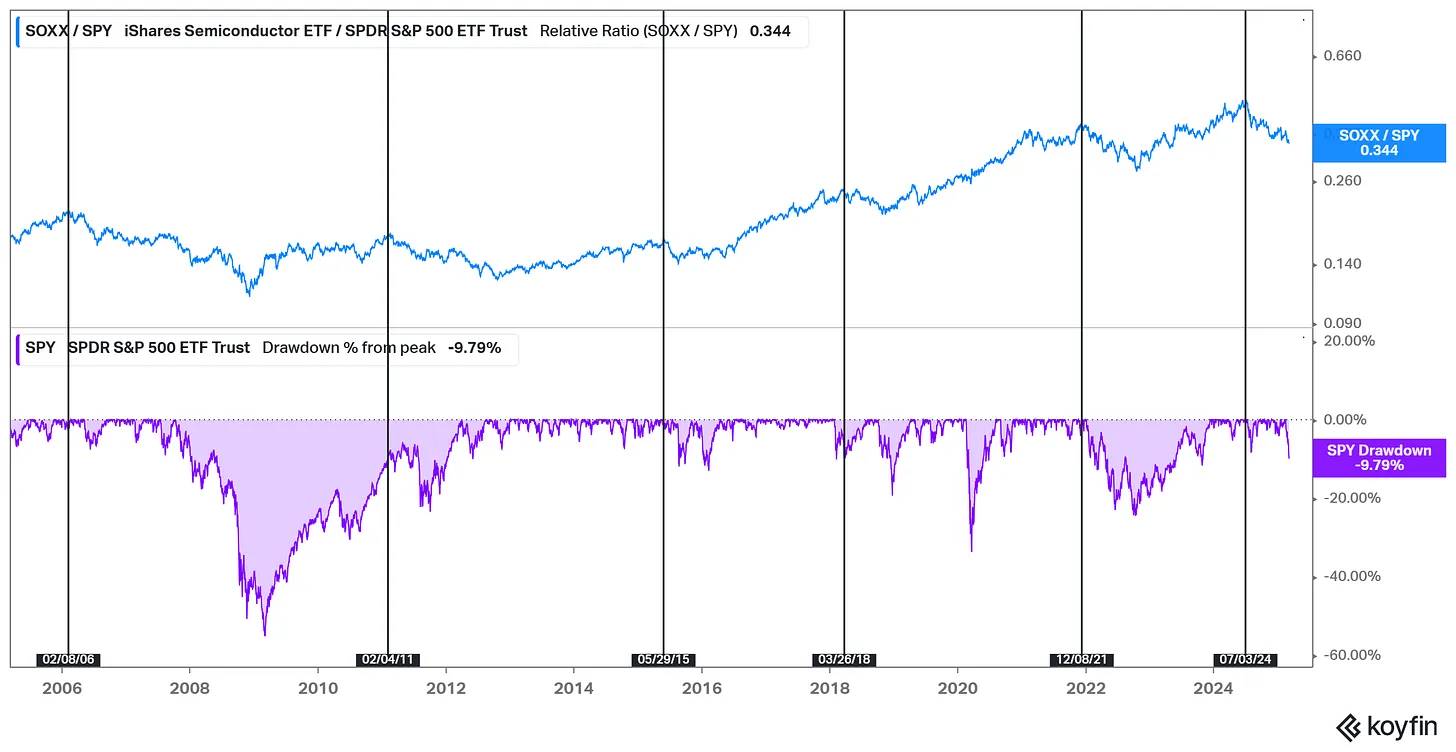
But the semiconductor industry is cyclical. We have experienced a decline, and if the S&P 500 fell 10%, the semiconductor industry would usually fall 20%, or even 40% down is possible. The market is telling us that the economic health is poor, which is a forward-looking indicator that reflects changes in semiconductor company orders and future revenue growth.
The question now is, how big will this decline be? We just saw a 10% decline, which is consistent with history. A decline usually takes more time and is usually more drastic than that. Considering that the growth panic in 2022 is enough to cause the market to fall by 20%, I think this decline may end in this range, not to mention that this growth panic is much worse than in 2022.
Will this lead to a recession? This question is beyond my prediction. But it is clear that there are now some economic factors that feel uncertain, such as trade headwinds and the possible flow of capital to areas outside the United States. It is at least certain that we are in a transformation of an institutional or environmental system. This adjustment period may be just a market correction and economic contraction.


 jinse
jinse