
Forward-looking trading dominates the market: over 10 billion US dollars inflows, BTC rebounds strongly

転載元: panewslab
05/07/2025·19hThe information, opinions and judgments mentioned in this report, such as market, projects, currencies, etc. are for reference only and do not constitute any investment advice.
Author: 0xWeilan
In the March report, we reminded "the opposite is the way" and pointed out that "the sell-off and panic have been released to the greatest extent", and "Q2 will usher in a reversal market." Finally, BTC ushered in a sharp rebound in April, with a strong increase of 14.11% in a single month, regaining all losses since the "tariff war".
The "reciprocal tariff war" that dominated the global financial market trend officially started in April, causing a fierce impact on the market, panic surged, and asset prices were significantly revised downward. But after the release of sentiment, with Trump's "softening" and the release of relatively resilient US economic and employment data, funds rushed to US stocks and crypto markets.
BTC adjusted ahead of the US stock market, and at the same time, the US stock market finished bottoming out, and the rise was driven by 10 billion yuan in fundraising. More importantly, after more than two months of adjustment, the chip structure has been greatly improved and the internal state has become more stable.
The S&P 500 and crypto markets have regained all losses since the "peer-to-peer tariff war". Compared with the "tariff war" that has not yet ended and the pending pending recession of the US economy, the market trend is very strong, and the latest information is constantly being priced. However, in order for the market to reverse this, the "tariff war" still needs to enter the third phase (an agreement reached) and confirmation of US economic data. There are many twists and turns in the middle.
**Macro Finance: Expected transactions in “peer-to-peer tariff war”
trigger sharp market revisions**
In the March report, we mentioned that "the new transaction judgment framework was initially established at the end of February, and the entire March revolved around the output of various economic, employment and interest rate data that were continuously released, which were input to the judgment framework." April continued to evolve on this basis, among which Trump's statements on the "reciprocal tariff war" and the "softening" of actions played a major role. Combined with the relatively strong performance of economic and employment data released in April, traders weakened their concerns about a "recession". Finally, forward-looking trading that bets on the tariff war will not lead to a recession dominated the market trend after the monthly revised market came to an end. Nasdaq and BTC, which fell first and then rose both recorded positive monthly returns.
On April 2, Trump declared a national emergency and launched reciprocal tariffs; on April 3, he imposed a 10% tariff on global goods and a 104% tariff on Chinese goods. Commerce Minister Lutnik and Finance Minister Bescent stressed their cooperation with allies to fight against China.
From April 3 to 5, US stocks fell in panic, with the three major stock indexes falling below the annual line, and the S&P 500 fell to January 2024 points. High-valuation stocks such as Tesla and Nvidia were cut in half. Both the long-term and short-term U.S. bonds fell sharply, and traders sold their stocks to avoid entering the bond market and European stocks. Over the weekend, a large-scale protest marches occurred across the United States.
On Monday, April 7, the S&P 500 VIX index broke through 60. The market selling wave has entered the second stage, and US bonds have been sold out in large quantities. Tariffs were officially implemented on the 9th, with the yield on the 2-year US Treasury rising by more than 4%, and the yield on the 10-year US Treasury on the 11th was close to 4.6%. On the 21st, the sell-off spread to the foreign exchange market, and the US dollar index fell to 97.911, surpassing the low point when the Carry Trade collapsed last year. The Nasdaq fell into a technical bear market.
Trump's "reciprocal tariffs" that exceeded expectations, his indifference to the decline in financial markets and the tough counterattack of the Chinese government have driven a fierce situation of "three kills" in U.S. stocks, bonds and foreign exchanges. This situation has caused greater panic in the market. Criticism and protests from the corporate and financial circles have been booming, and has shaken the market's fundamental confidence. Trump was forced to make concessions.
First, 90-day tariffs will be suspended for all countries except China to ease tensions with allies and buy more time for negotiations. On April 23, it was reported that the Trump administration could significantly cut high tariffs on Chinese goods by 104%, or even more than half, to ease tensions with China. During this period, Trump stressed that he had been in contact with the Chinese government, but the Chinese government denied this.
Gold became the only winner, and has ushered in a strong round of gains since the 9th, rising from a high of $2,970 per ounce to 3,499.93 (April 22). But since the 23rd, it was reported that Trump has been considering cutting high tariffs on Chinese goods, it has entered a continuous adjustment and fell to $3,288.54 per ounce by the end of the month. But the month still recorded a sharp increase of 5.08%.
US stocks temporarily rebounded strongly after bottoming out on April 4. After Trump's "softening" on the 23rd, the rebound continued. By the time of completion of this report (May 2), the Nasdaq and S&P 500 have completely recovered the decline caused by the tariff war.
Looking at the whole month, the Nasdaq rose 0.85% in April, the S&P 500 fell 0.76%, the Dow Jones fell 3.17%, and BTC rose 14.11%.
During this process, although the market once bet on the Fed would initiate a temporary interest rate cut and expected the probability of interest rate cuts in May to exceed 80%, the Fed has always maintained a tough attitude and only emphasized again that if there is an accident in the employment market, it will intervene in the market and release a little "dove" information.
On April 10, the U.S. Bureau of Labor Statistics released data that thanks to the decline in energy prices, the CPI (consumer price index) in March fell by 0.1% month-on-month (after quarterly adjustment), the first monthly decline in nearly five years, lower than the market expects an increase of 0.1%. The annualized CPI growth rate fell from 2.8% in February to 2.4% (no quarterly adjustment). Core CPI (excluding food and energy) grew by 0.1% month-on-month (0.2% lower than expected), and an annualized growth of 2.8%, the lowest since March 2021.
On April 30, the U.S. Bureau of Economic Analysis released its preliminary estimate for the first quarter that the annualized quarterly rate of real GDP fell by 0.3%, the lowest level since the second quarter of 2022, far lower than the growth rate of 2.4% in the fourth quarter of 2024, and also lower than the market's expectations of 0.4% (Dow Jones consensus forecast) or 0.3% (the median survey of the Wall Street Journal on April 12).
On May 2, the Bureau of Labor Statistics (BLS) released its April non-farm employment report, with the number of non-farm employment increasing by 177,000, higher than Dow Jones's forecast of 133,000, but lower than the 185,000 revised in March (the February and March data were revised down by 58,000). An average of 193,000 new jobs per month in the past six months shows that the labor market is still resilient. The unemployment rate remained at 4.187% in April (4.152% in March), in line with expectations, with a slight increase in labor force participation, indicating that the market is relatively stable. Average hourly wages increased by 0.2% month-on-month (0.3% below expectations) and an annualized increase of 3.8% (3.9% below expectations), indicating moderate wage pressure.
Inflation data cooled down, and employment data remained strong. This temporarily reduces market concerns about the recession, coupled with Trump's "softening", and although the tariff war is still difficult in the second phase ("negotiation"), funds from retail investors and active funds have launched forward-looking trading, and large-scale buying has driven a strong rebound in U.S. stocks.
EMC Labs believes that the panic caused by the medium- and short-term tariff war has been relatively fully released, and GDP data shows that at least the US economy has not suffered major damage. In addition, the Trump team seems to be returning to "rationality" from "out of control", which is why forward-looking funds dare to buy in large quantities. We tend to be that the adjustment from February to April was a drastic adjustment of the US stock market, which had risen for two consecutive years, under the impact of the "tariff war", and a technical test of the bear market, but there is no data that fully demonstrates that the US economy will experience a recession. At present, US stocks are worth a certain amount of decline, but they are not cheap. The market pricing is relatively sufficient. If the upward trend continues, more conditions will be needed to support it. For example, the "tariff war" will further ease and the CPI will further decline. The interest rate cut is not optimistic. CME FedWatch shows that the market's expectations for interest rate cuts have been postponed to July. After a sharp rebound, we tend to make neutral judgments and need to pay close attention to the progress of the tariff war and economic data. If there is a trend of economic deterioration, there may be another downward revision.
Crypto Assets: Stable Chip Structure + Long-term
It fell in a collapsed manner at the beginning of the month and rebounded sharply at the end of the month. April BTC trend is a model of "reverse trading", buying in fear waiting for the rapid rebound of asset prices when the tense is easing.
In April, BTC opened at $82,534.31, falling to $74,420.69, closing at $94,182.54, up 14.11% for the whole month to $11,648.22, with a monthly amplitude of as high as 26.12%.
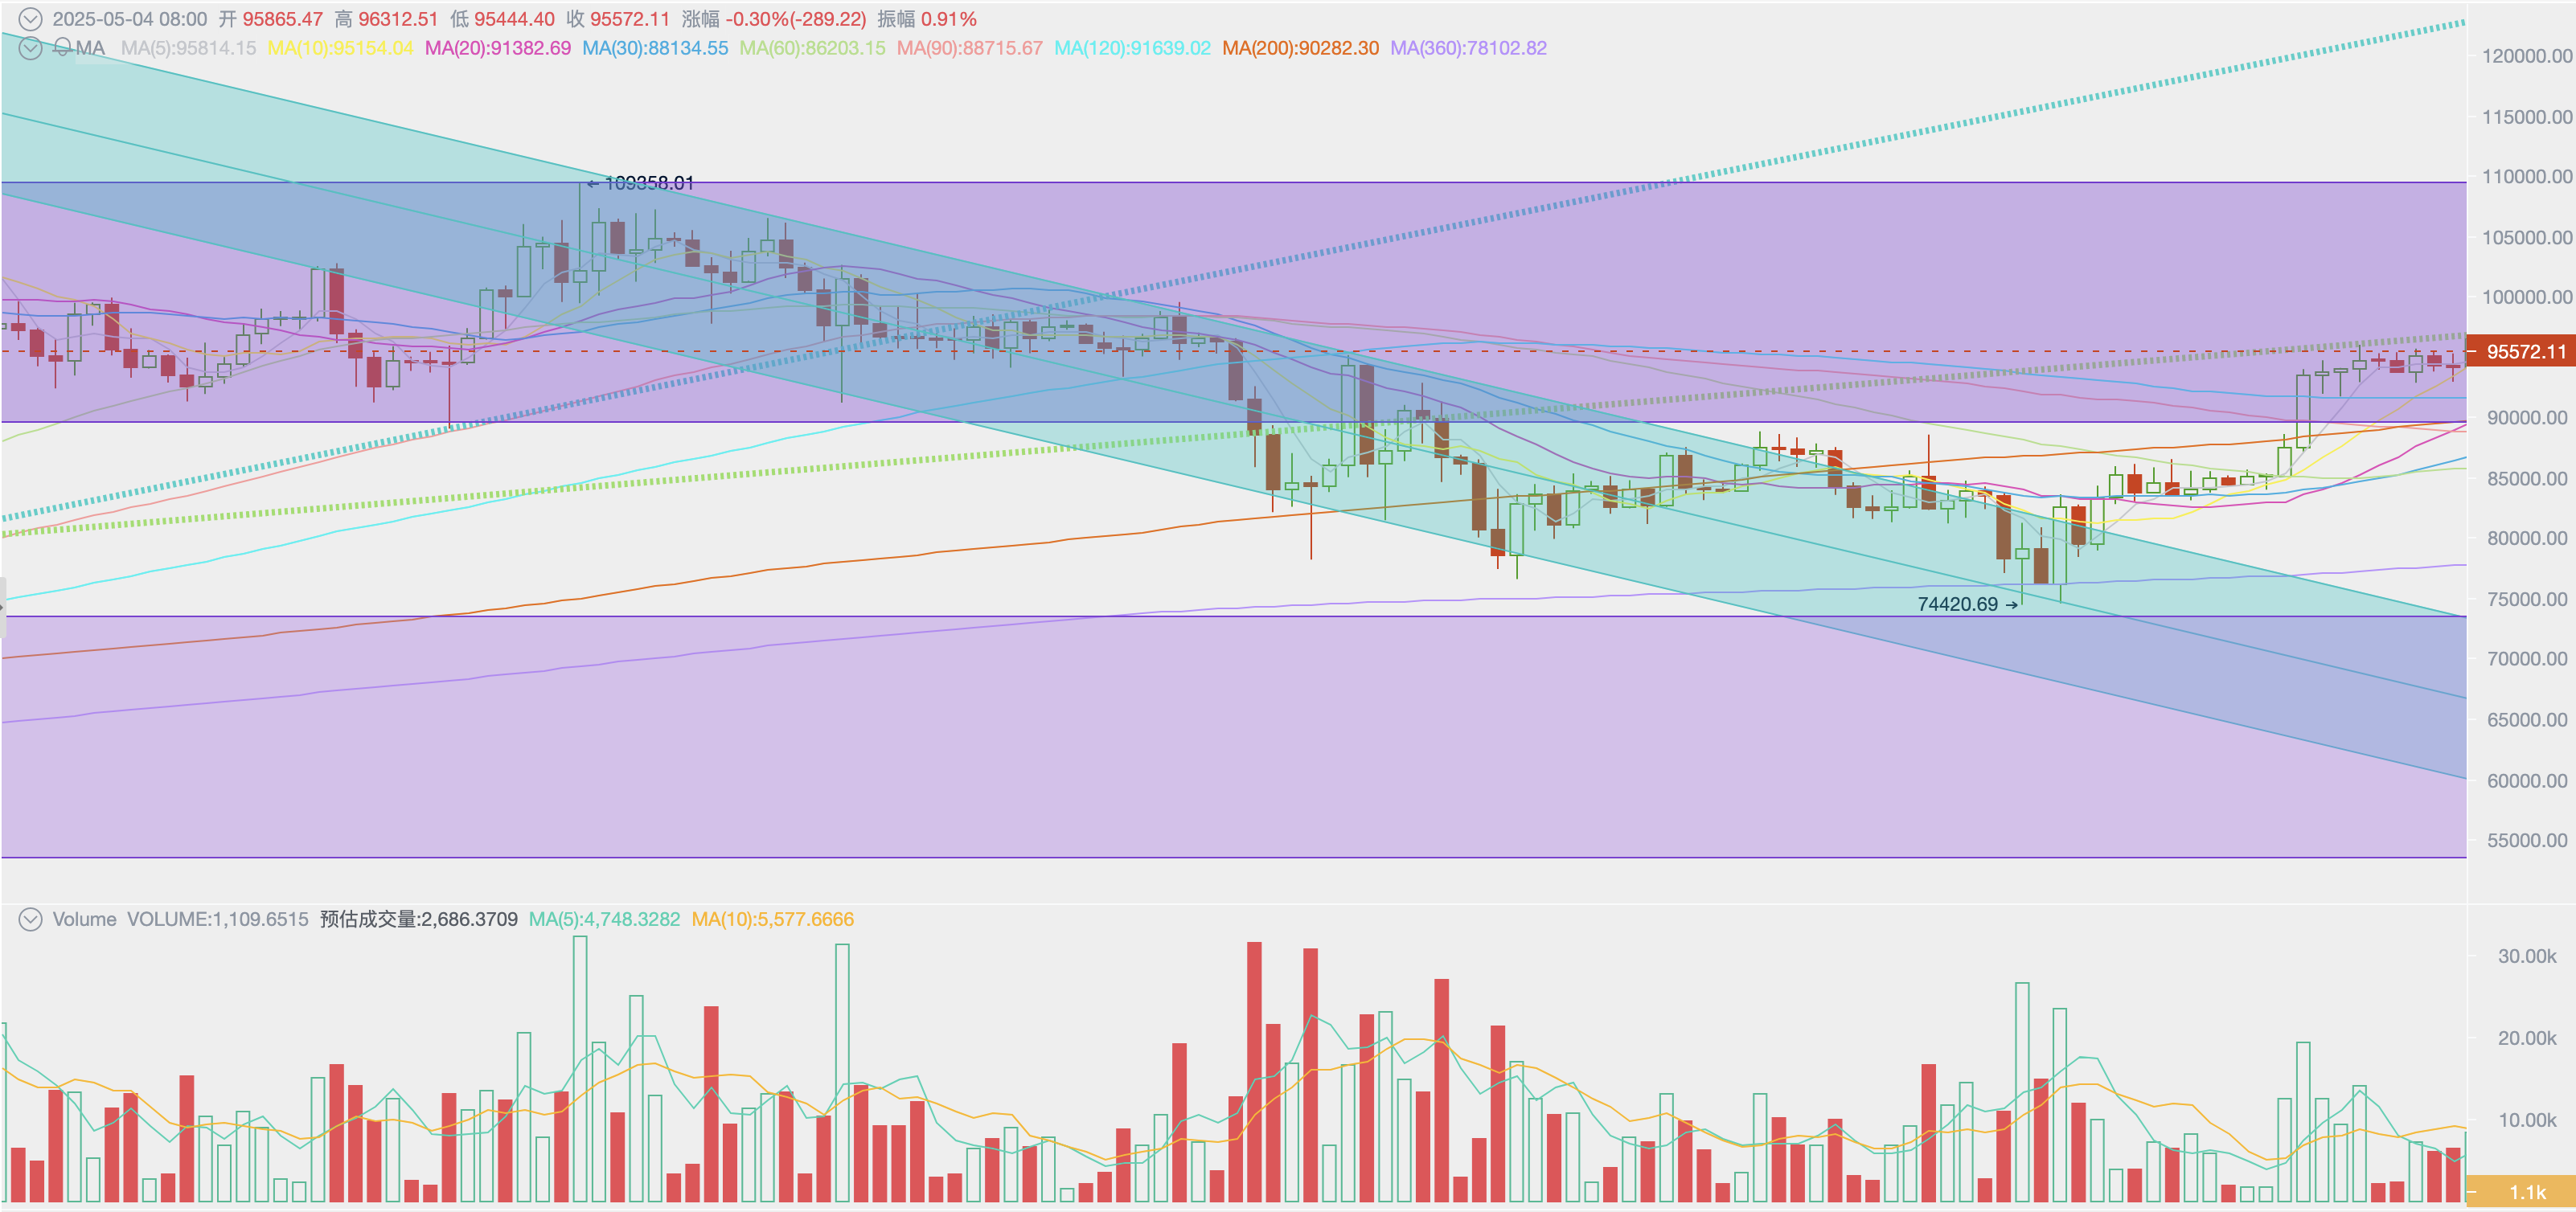
Daily trend of BTC price
The trend of the whole month was first down and then rising, with the lowest point appearing on "Black Monday" on April 7. After the "reciprocal tariffs" were officially implemented, it bottomed out and rebounded and gradually rose. Calculated based on intraday rise and fall, the rising day in the 30 trading days is much higher than the falling day.
Technically, BTC returned to the annual line three times in the plunge of US stocks, and completed the confirmation of the long-term trend, and broke through the 200-day line with a big rise of 6.82% on April 22, returning to the "Trump bottom" (the box structure constructed after Trump's victory) and approaching the "first upward trend line" of this bull market (the green dot line in the figure above).
Compared with US stocks, BTC has been very strong, thanks to the price pullback that began in March, increasing holdings by long-term holders and large-scale investors, and favorable support at the policy and use cases.
Since Trump signed an executive order to establish a "strategic Bitcoin reserve" in March, many states in the United States have continued to promote their respective "Bitcoin Reserves Act". On April 30, the Arizona House of Representatives passed two Bitcoin reserve bills, which are currently awaiting signing by the governor. If the bill comes into effect, Arizona will become the first state in the United States to allow state fiscal holdings of Bitcoin. Once the Arizona bill officially takes effect, I believe that the advancement of states will also accelerate.
BTC’s use case expansion and price increase are in a process of mutually strengthening continuous feedback. From March to April, the turmoil and revisions in global financial markets triggered by Trump's tariff war temporarily interrupted the process. However, the internal currency holding structure and market movement of the crypto market remain intact and stable. Once the panic subsides, BTC will regain its upward trend. With the future market, with the tariff war and potential turmoil in macro finance, BTC prices will still have twists and turns. Breaking through the previous highs is waiting for the tariff war to settle and the US economy will not fall into recession.
**Chip structure: long-term hands and sharks increase their holdings,
long-term buyers buy goods**
On October 4, 2024, with funds surging into the market, the long-term group launched the second selling point in this cycle. After absorbing the selling pressure, the strong capital inflow continued to push the price to nearly $110,000.
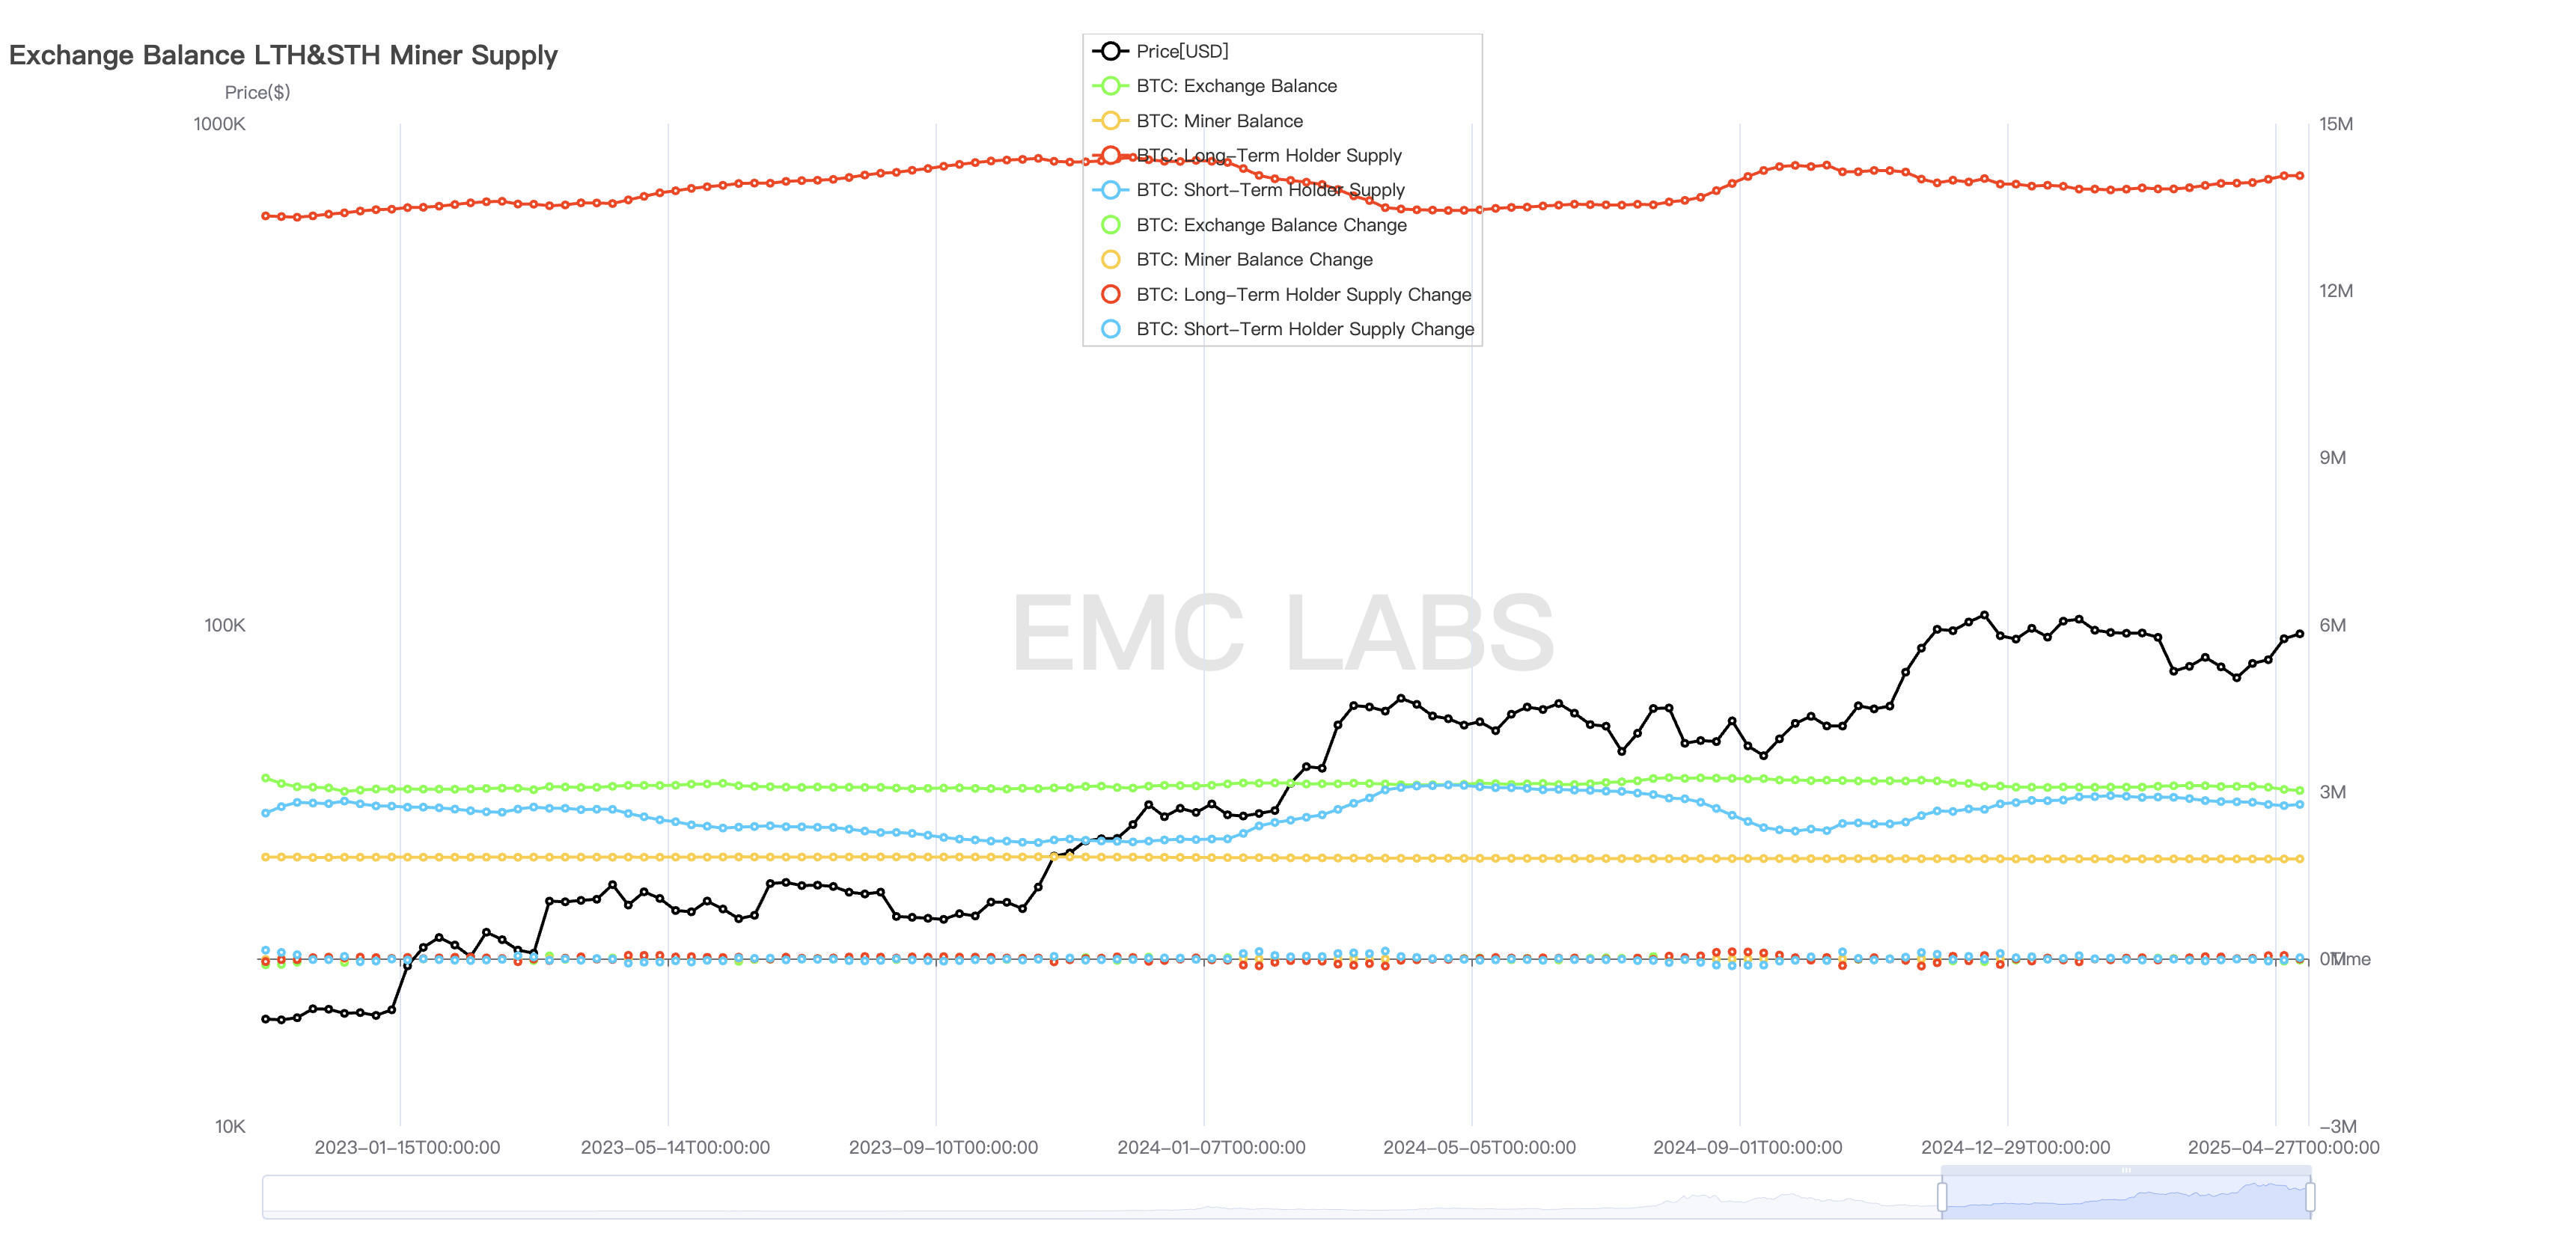
BTC scale held by long hands, short hands and exchanges
After March, with the loss of liquidity, BTC price fell sharply, and since then, the long-term group once again played the role of a "stabilizer" and changed from selling to increasing holdings.
In addition, Shark, one of the large group of investors with a holding volume between 100-1000 BTC, also continued to increase its holdings during the decline, and accelerated its purchases in late April, increasing its holdings for more than 80,000 throughout the month, becoming the backbone of turning the tide. It is worth noting that this group is also the main buyer in the range of BTC prices from US$70,000 to US$100,000 from October to December 2024. Based on the characteristics of this group's shopping scale far exceeding the scale of selling goods in this cycle, it can be judged that the behavior of this group is in line with the characteristics of long-term investors, and its recognition of this price range will help price stability.
After buyers from all sides swept the goods, the exchange's BTC stock decreased by about 60,000 in April.
Prices began to fall in late February, and by the end of April, the price returned to the price in late February. With the market fluctuations, chips are fully exchanged. Compared with the chip distribution on January 31 and April 30, you can see that the center of gravity of the chips in the range of 74,000 to 100,000 US dollars has shifted significantly, and some chips with a price of more than 100,000 US dollars have moved down to the range of 74,000 to 94,000.
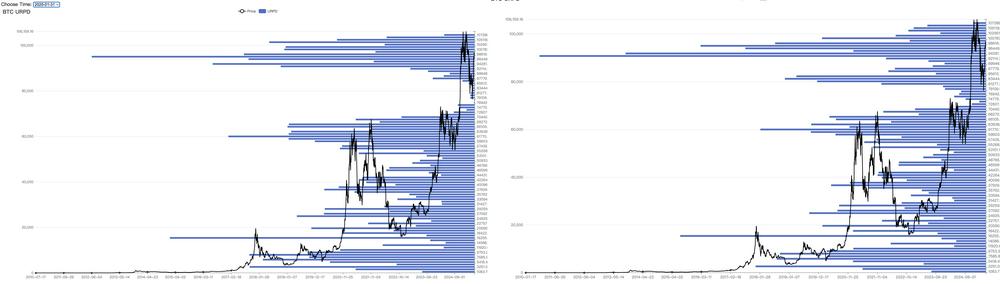
BTC chip distribution (January 31 vs April 30)
The market fluctuations in the past two months, from the perspective of chip distribution, FOMO's new chips were forced to sell during a sharp decline, while the lack of chips in the past 7.4-9.4 range has been refilled. According to eMerge Engine data, short handheld positions have now left floating losses, and BTC, which is in a floating losses state in the entire chain, has also fallen to 14%. The market selling pressure caused by panic and losses has improved greatly.
Funds: Turn the tide and grab the rush for more than 10 billion yuan
Taking the middle of the month as the boundary, under the pressure of the "tax war" and macro-financial panic, funds were generally outflowing in the first half of the month, but stablecoin funds continued to flow in since April. By the middle of the month, with Trump's "softening" and the US stock market stabilizing rebound, the BTC Spot ETF channel funds also began to rush to raise funds, quickly pushing the BTC price to above $94,000.
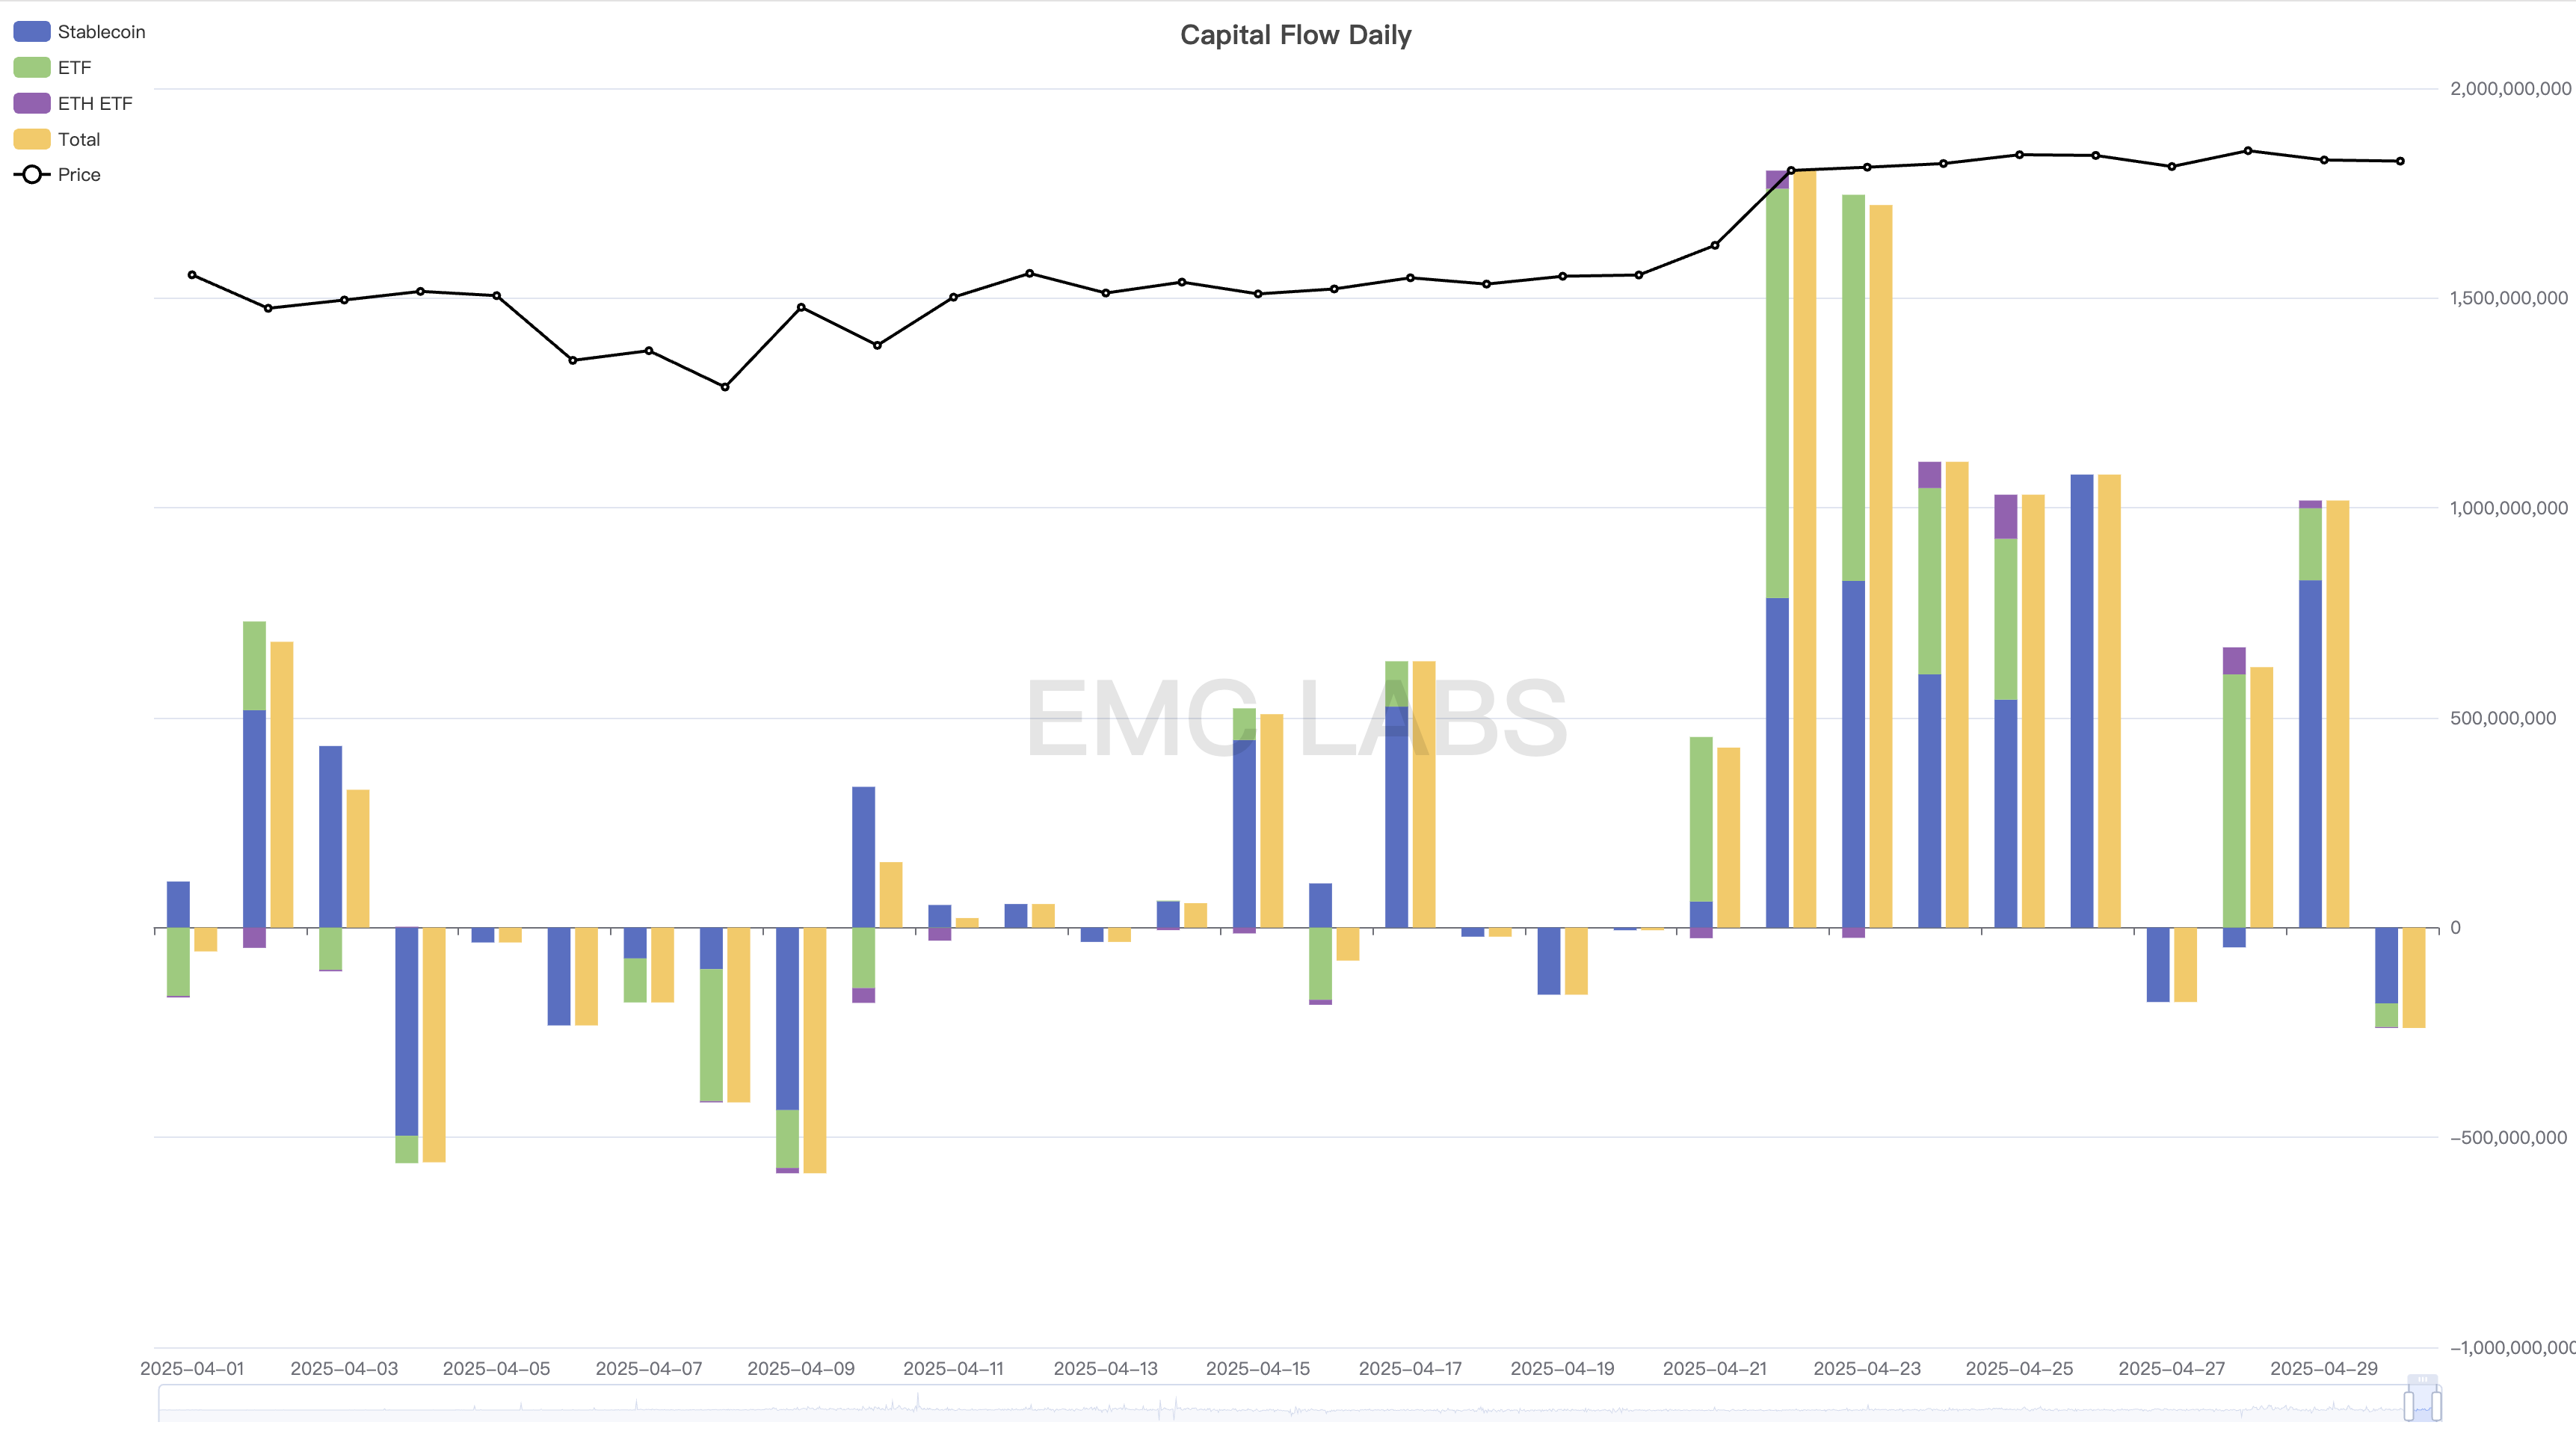
Statistics on inflows and outflows of funds in crypto market (Day)
From a monthly perspective, the ETF channel funds that hold short-term pricing power in February and March showed an outflow trend to drive BTC prices down, while the overall capital inflow in April reached US$8.4 billion, becoming the sixth largest inflow month since this cycle.
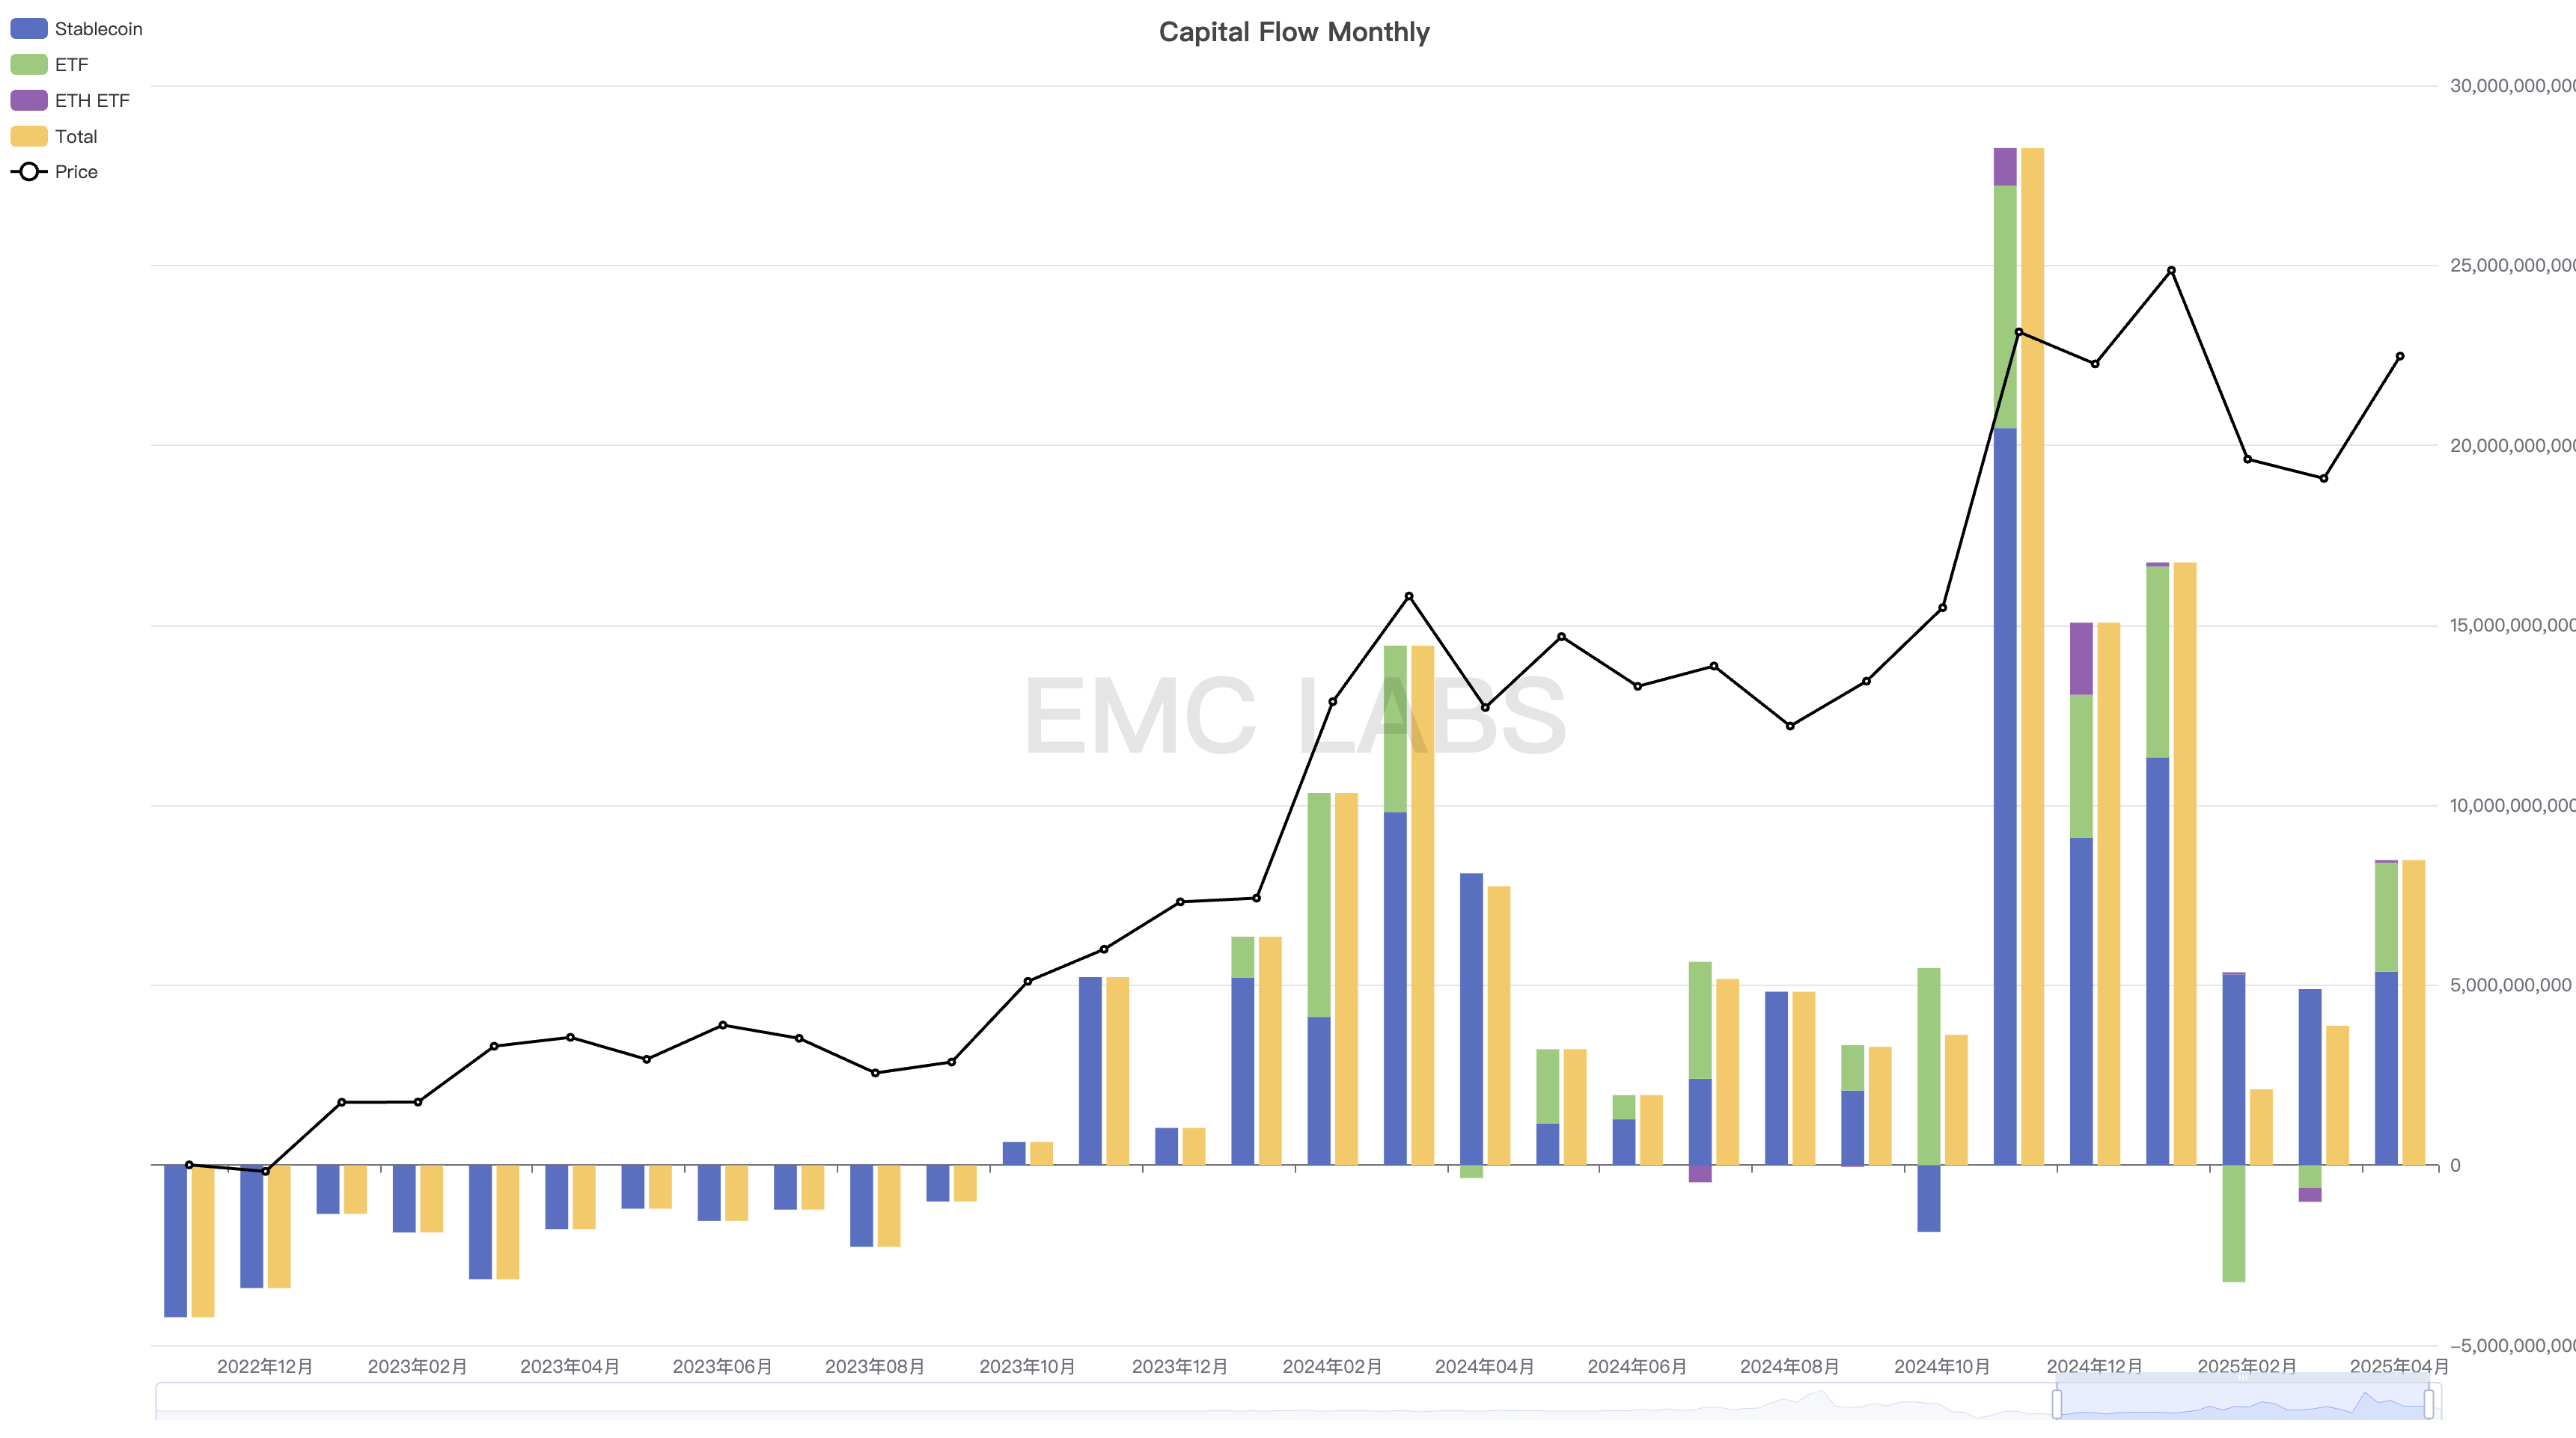
Statistics of inflows and outflows of funds in crypto market (month)
The above statistics do not include the data on Strategy's increase in position. According to its announcement, Strategy's increase in position three times through fundraising in April, purchasing a total of 25,370 BTC and investing more than US$2.2 billion. Therefore, the scale of inflows in the entire market exceeded 10 billion US dollars in April.
The price trend of BTC is a market where capital inflows and outflows appear. The current statistics can be divided into three categories: one is the BTC Spot ETF channel funds, which often follow the fluctuations of US stocks; the other is the fundraising of Strategy, which has good inflows; the other is the stablecoin channel funds, that is, the on-site funds, which have only had a net outflow for one month since the inflow in October 2023, and have been inflowing positively in other months (stablecoin funds do not flow into the crypto market).
Although the crypto market experienced sharp fluctuations in February and April and once technically fell into a bear market, based on the analysis of the trend of comprehensive funds and long-term funding, we believe that the market cycle is still running in the rising period, that is, the bull market. EMC Labs believes that after the adjustment, the chips will return to the long-term and large-scale groups. This downward adjustment will help strengthen the chip structure. When the impact of the tariff war gradually fades and market trading enthusiasm rekindles, BTC prices will likely break up again.
Conclusion
In the March report, we pointed out that "after experiencing the storm in the first quarter, the outlook for the second quarter is still not clear enough, but the most painful moment may have passed. When Washington and the Federal Reserve return to a rational game state, the market should be able to return to its own operating rules."
In April, market performance initially proved this judgment, behind which was Trump's "softening" and the relative strength of US economic data.
After months of market adjustment and chip redistribution, the crypto market has become more stable, with more chips in the long hand holding, the pressure of floating losses in the short hand has been eliminated, and floating profits have not yet appeared, and only 14% of Bitcoin is in a floating loss state. This internal state provides solid support for the upward trend of the market.
However, the uncertainty outside the market, especially the "reciprocal tariff war", is very high. In addition, the "reciprocal tariff war" may cause the US economic recession and the rise in inflation again, which may trigger another downward revision of the US stock valuation and a further delay in the Federal Reserve's interest rate cut. This is especially important.
Market trends are the result of dynamic games between all parties in trading under dynamic conditions. We are confident in the second half of BTC and the long-term trend, but we need to be wary of the unpredictable damage of the "peer-to-peer tariff war" to funds, sentiment and the global economy.


