
Solana network capital inflow surges - will SOL prices rise with it

Reprinted from jinse
04/17/2025·14DAuthor: Biraajmaan Tamuly, CoinTelegraph; Translated by: Deng Tong, Golden Finance
Over the past 30 days, cryptocurrency market participants have bridged more than $120 million in liquidity from other blockchains to Solana, a sign that confidence in the network is rekindled. According to Debridge, traders transferred the highest amount from Ethereum at $41.5 million, followed by $37.3 million inflows from Arbitrum.
Meanwhile, users on Base, BNB Chain and Sonic transferred $16 million, $14 million and $6.6 million, respectively.
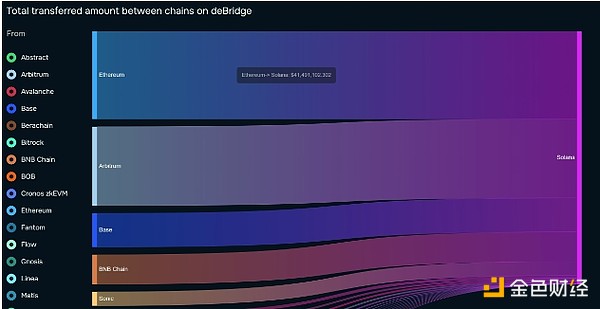
Total amount transferred from other chains to Solana. Source: debridge
Solana’s liquidity regression contrasts with the recent challenges the network faces. Solana welcomes $485 million in investors who have moved funds to other blockchains such as Ethereum and BNB chains after Argentina President Javier Milei was involved in the LIBRA meme coin scandal.
The current influx of liquidity coincides with the double-digit rise in Meme coin prices, with POPCAT, FARTCOIN, BONK and WIF rising 79%, 51%, 25% and 21% respectively in the past seven days.
However, further analysis showed that the total expense incurred in March was slightly less than $46 million. By comparison, Solana's expenses peaked at $400 million in January 2025. Currently, the total expense incurred in April is about $22 million.
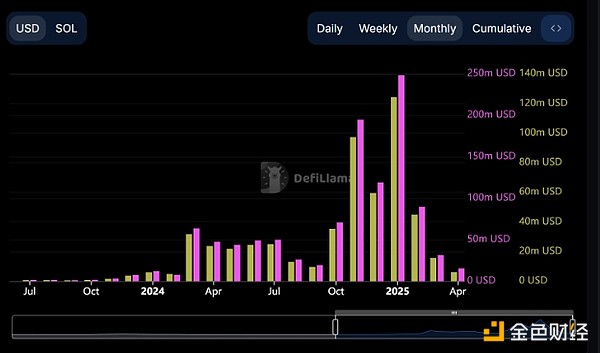
Total expenses and revenues incurred by Solana. Source: DefiLlama
Solana prices will face difficult rises in the future
From a technical point of view, Solana is still on a bearish trend on the 1-day chart. SOL must break through the bullish structure and close above $147 to achieve a bullish trend change.
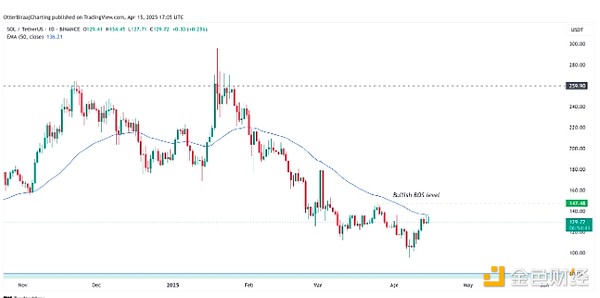
Solana 1 day picture. Source: Cointelegraph/TradingView
Solana is still below $140, with the 50-day exponential moving average (blue line) forming strong resistance. If the closing price is above the 50-day moving average, it is expected to increase the likelihood of a trend reversal, but the SOL price has stalled at the current level.
On the Lower Time Frame (LTF) chart, Solana shows a bearish divergence between the price and the Relative Strength Index (RSI) indicator. Historically, bearish divergence signals indicate Solana will enter a pullback period in 2025. SOL has experienced four bearish divergences since January, each happening after a price drop.
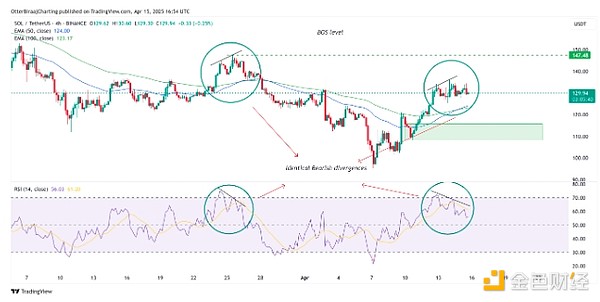
Solana 4-hour chart. Source: Cointelegraph/TradingView
Its previous and current bearish divergence phenomenon is very similar. The two divergences occur when the price temporarily breaks through the 50-day and 100-day moving averages (blue and green lines) on the 4-hour chart, which ultimately leads to a price drop.
Solana may therefore take a similar path in the coming days. The 1-day demand area is the direct focus area for rebounding between $115 and $108.
Meanwhile, Glassnode reported in a recent X post that Solana's implemented price distribution has changed significantly, with more than 32 million SOLs being purchased at the $130 price point in the past few days. This accounts for 5% of the total supply, which means the $130 price point could be a strong support level in the future. "Below $129, we expect $18 million (3%) to be at $117.99; above $129, $27 million (4.76%) will be at $144.54. In the short term, $144 may become the resistance level, $117 may become the lower limit of the price range, and $129 will become the key pivot area."
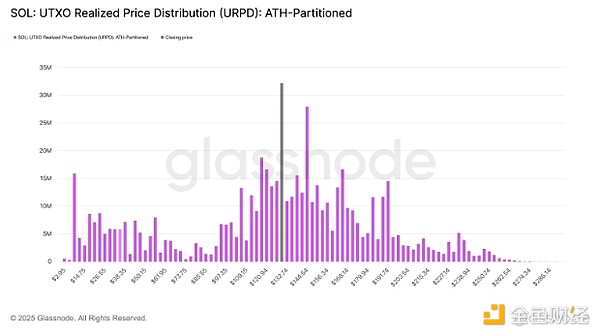
Solana UTXO achieves price. Source: Glassnode

 panewslab