
"MuToujie" fund Ark Invest announces Bitcoin valuation model: Starting with a single coin of $500,000 in 2030

Reprinted from panewslab
04/28/2025·17DOriginal text: David Puell, Ark Invest analyst;
Translator: CryptoLeo; Editor: Hao Fangzhou
Editor 's note:
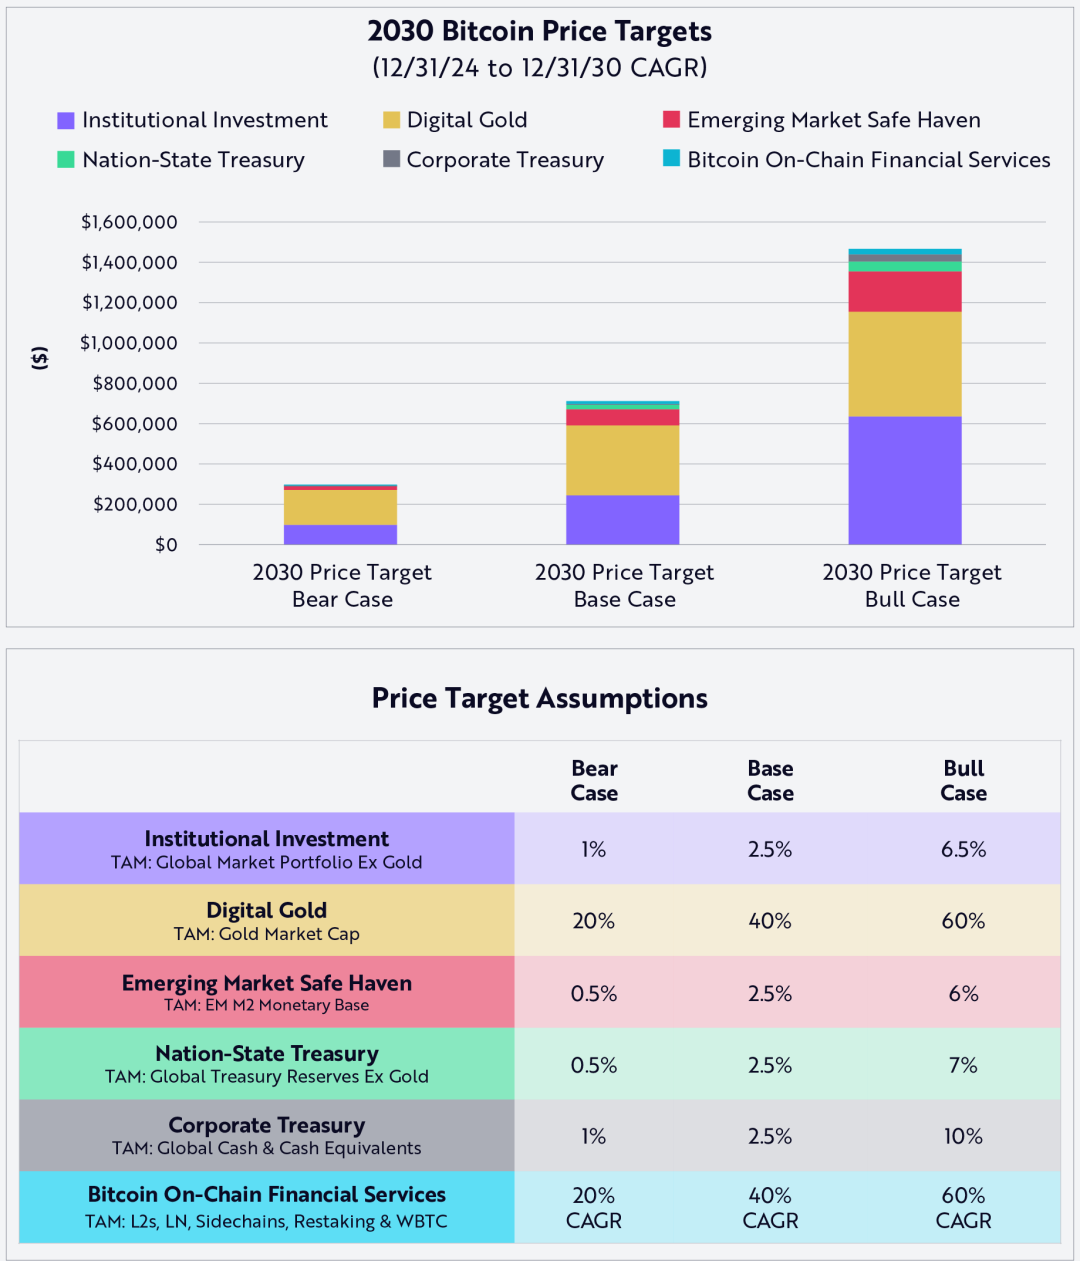
At the beginning of the year, Bitcoin’s “dead bulls” and Ark Invest released the Big Ideas 2025 report, mentioning the three price targets that Bitcoin is expected to achieve in 2030, namely: US$300,000 (bear market), US$710,000 (benchmark market) and US$1.5 million (bull market). At that time, he was just "simply shouting" to a price that was far beyond the market expectations (as crazy as Plan B), and did not announce the actual estimation process.
Two months later, Ark Invest finally released its modeling method and logical assumptions for Bitcoin 2030 price targets, which predicts Bitcoin’s price in 2023 through the total potential market size (TAM) and penetration rate (popularity or share).
What is more inspiring (exaggerated) is that the operating based on Bitcoin active supply indicators created by Ark Invest, the prices of Bitcoin in 2030 are: $500,000 (bear market), $1.2 million (benchmark market) and $2.4 million (bull market). If any of these TAMs or penetration rates fail to meet expectations, Bitcoin may not meet these price targets. Therefore, there are some risks and deviations in this model. The following are the specific details of the Bitcoin price forecast, compiled by Odaily Planet Daily.
Price targets and assumptions
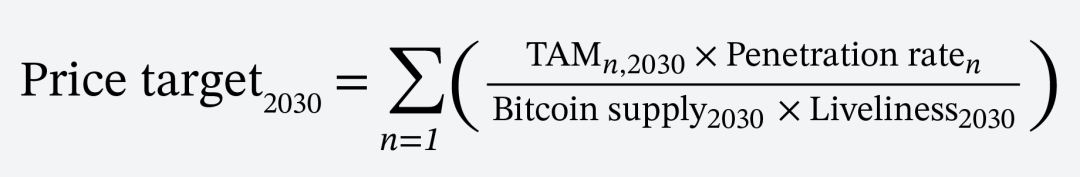
Our price target is the sum of the contributions of TAM (total potential market) by the end of 2030, based on the following formula:
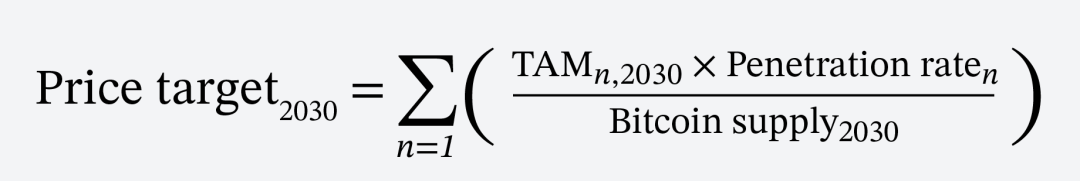
Odaily Planet Daily Note: This formula predicts the price of Bitcoin in 2030 by quantifying the dynamic relationship between market demand and Bitcoin circulation. The Bitcoin price is derived by multiplying the maximum dollar benchmark demand scale of the segment by the penetration of Bitcoin in its market and dividing it by the circulating supply of Bitcoin, and summing the prices of all segments (segment/concept below) to draw the forecast price of Bitcoin in 2030.
Our estimate of supply is based on Bitcoin’s circulation and will be close to 20.5 million BTC to be mined by 2030. The contribution of each variable to the price target is as follows:
Contributors to expected capital accumulation (main):
1. Institutional investment is mainly through spot ETFs;
2. Bitcoin is called "digital gold" by some people. Compared with gold, it is a more flexible and transparent means of value storage;
3. Emerging market investors seek safe havens that can protect them from inflation and currency depreciation.
Contributors to expected capital accumulation (secondary):
4. National treasury reserves, other countries follow the example of the United States and establish strategic reserves for Bitcoin;
5. Enterprise treasury reserves, as more and more companies use Bitcoin to diversify fiat cash;
6. Bitcoin on-chain financial services, Bitcoin is a substitute for traditional finance.
Excluding digital gold (as it is the most direct zero-sum competitor for Bitcoin, our model excludes it), we conservatively assume that the TAMs of the above contributors (specifically 1, 3, 4 and 5) will grow at a CAGR of 3% over the next six years. For the sixth contributor, Bitcoin’s on-chain financial services, we assume that its 6-year compound annual growth rate is between 20% and 60%, based on the cumulative value as of the end of 2024, as shown below:
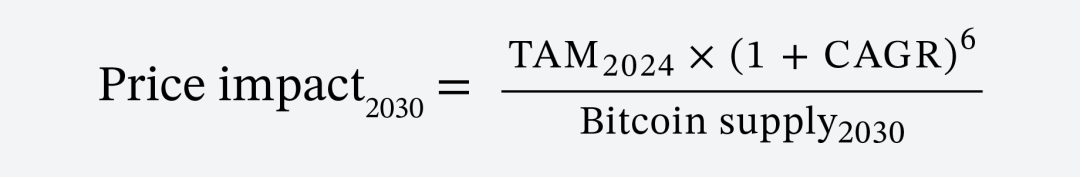
Odaily Planet Daily Note: This formula calculates the Bitcoin TAM in 6 years by dividing it by Bitcoin’s 2030 circulating supply to calculate its price.
Finally, we describe the contribution of TAM and penetration to bear markets, benchmark markets, and bull market price targets, respectively, as shown below:
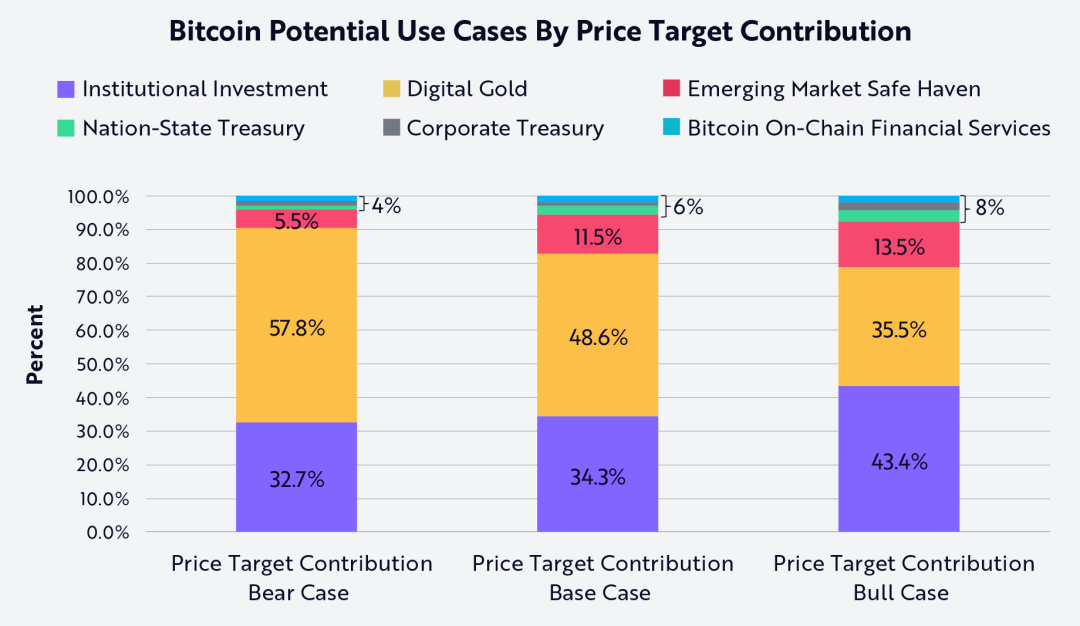
As shown in the above figure, “digital gold” contributes the most to our bear and benchmark scenarios, while institutional investment contributes the most to our bull scenarios. Interestingly, the contribution of national treasury, corporate treasury, and Bitcoin on-chain financial services in each scenario is relatively small. In the following table, we detail the relative contributions of our forecasted six sources of capital accumulation to bear markets, benchmark markets and bull markets:
Odaily Planet Daily Note: The following charts are the expected TAM of the market segment in 2030, Bitcoin penetration rate under the three market conditions and the contribution ratio in the above chart.
**1. Potential contributors to capital accumulation: Institutional
investment**
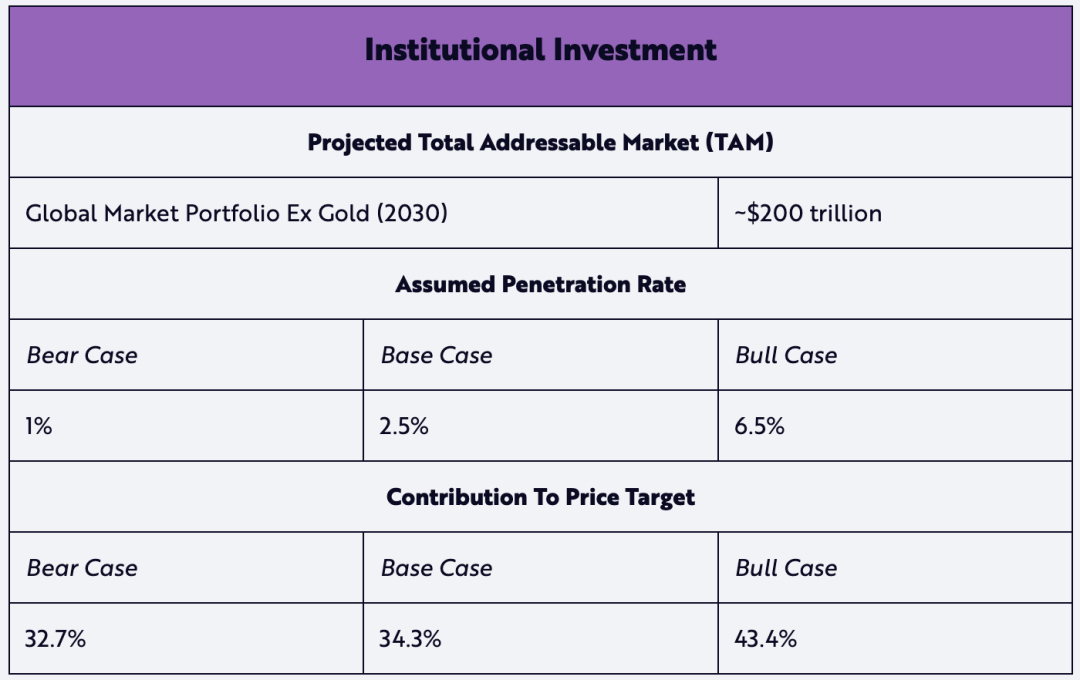
According to State Street, the global market portfolio is defined as follows:
The market value of all investable capital assets divided by the sum of all assets. As the sum of all positions generated by collective decisions by investors and issuers, as well as capital suppliers and demanders, the global market portfolio can be regarded as the actual representative of the set of investable opportunities for all investors around the world.
As of 2024, the global portfolio’s TAM was approximately US$169 trillion (excluding 3.6% of gold). Assuming its compound annual growth rate is 3%, its value will reach about $200 trillion by 2030.
We assume that the penetration rates of bear markets and benchmark markets are 1% and 2.5%, respectively, both lower than the current share of gold's 3.6%. Therefore, bear markets and benchmark markets represent conservative views on Bitcoin adoption. In a more aggressive bull market, we assume Bitcoin penetration is 6.5%, almost twice the current share of gold.
2. Potential contributors to capital accumulation: Digital gold
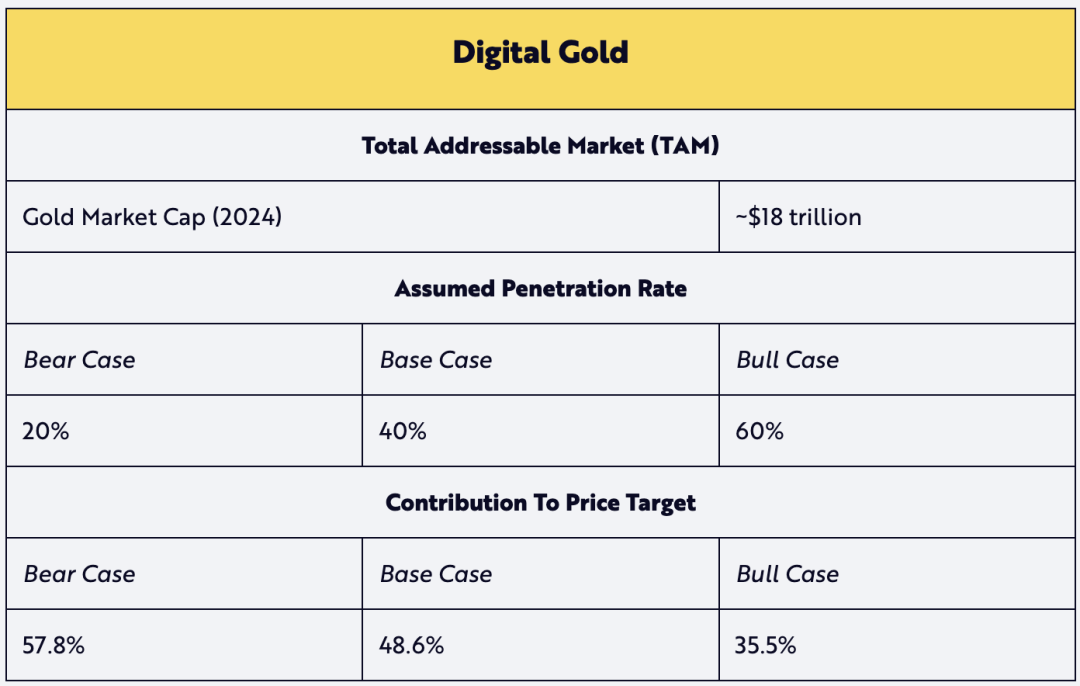
The contribution of digital gold assumes the ratio of TAM to gold's current market capitalization. Given the positive penetration rate given, we assume that gold will not grow in 2030, thereby reducing its expected value. We believe Bitcoin as digital gold is an attractive narrative that will drive its penetration.
**3. Potential contributors to capital accumulation: Emerging market
safe haven**
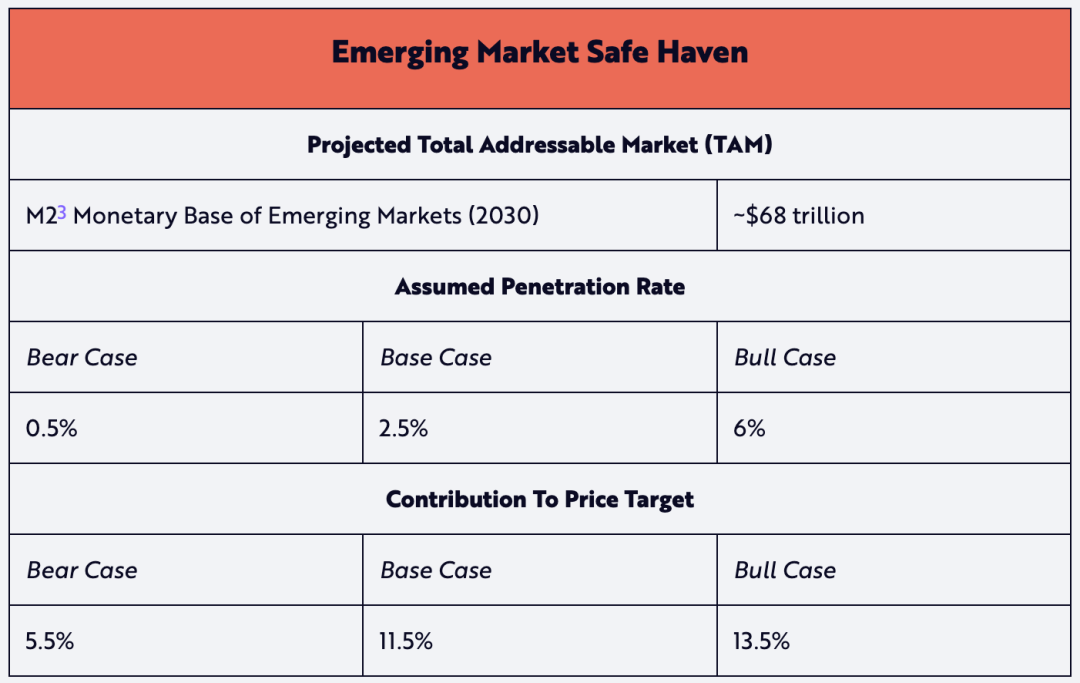
Emerging market safe haven TAM is based on the monetary basis of all developing countries (also known as “non-developed” economies as defined by the IMF/CIA). We believe that this use case of Bitcoin has the greatest potential for capital appreciation. In addition to its store of value characteristics, Bitcoin’s low threshold also provides an investment option for individuals who own the internet that may bring capital appreciation over time, unlike defensive allocations such as the US dollar – thereby maintaining purchasing power and avoiding depreciation of their own currencies.
Odaily Planet Daily Note: "M2" is an indicator of the U.S. currency stock, including M1 (money and deposits held by non-bank public, checkable deposits and traveler's checks) plus savings deposits (including money market deposit accounts), small time deposits below $100,000, and retail money market mutual fund shares.
4. Potential contributors to capital accumulation: state treasury
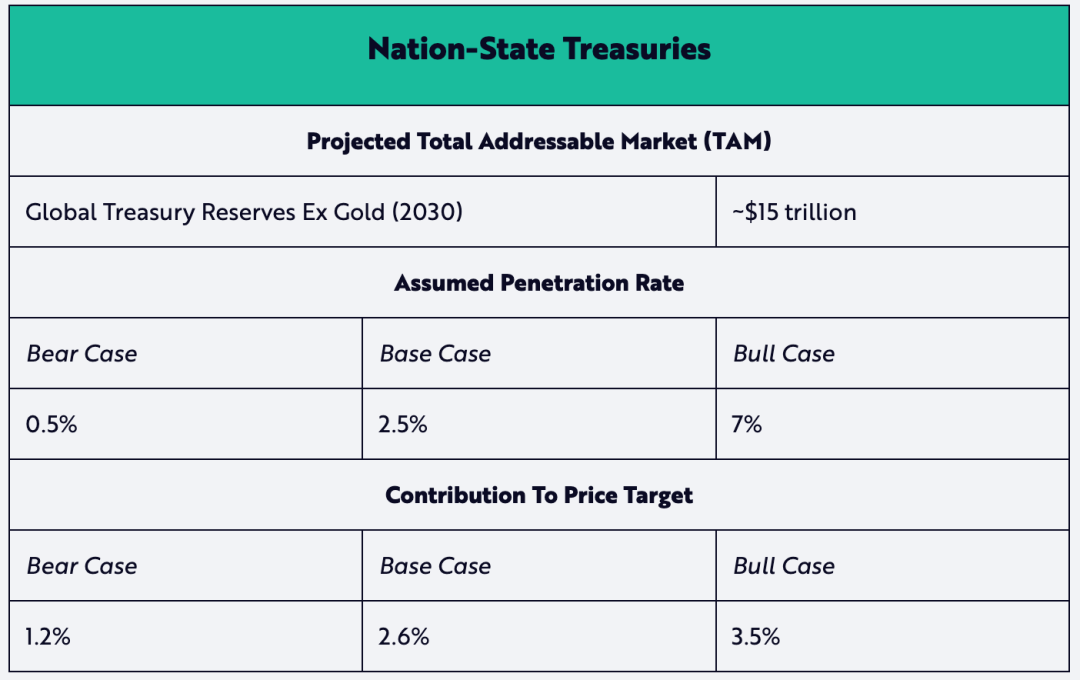
While El Salvador and Bhutan are currently leading the world in terms of Bitcoin adoption rates at the national level, advocates of Bitcoin’s strategic reserves are growing — especially after Trump took office, when he issued an executive order on March 6 to establish BTC reserves in the United States. Although our bear market assumptions and benchmark assumptions are relatively conservative, we believe that the situation in the United States may further verify the penetration rate of 7% in our bull market assumptions.
**5. Potential contributors to capital accumulation: corporate treasury
bonds**
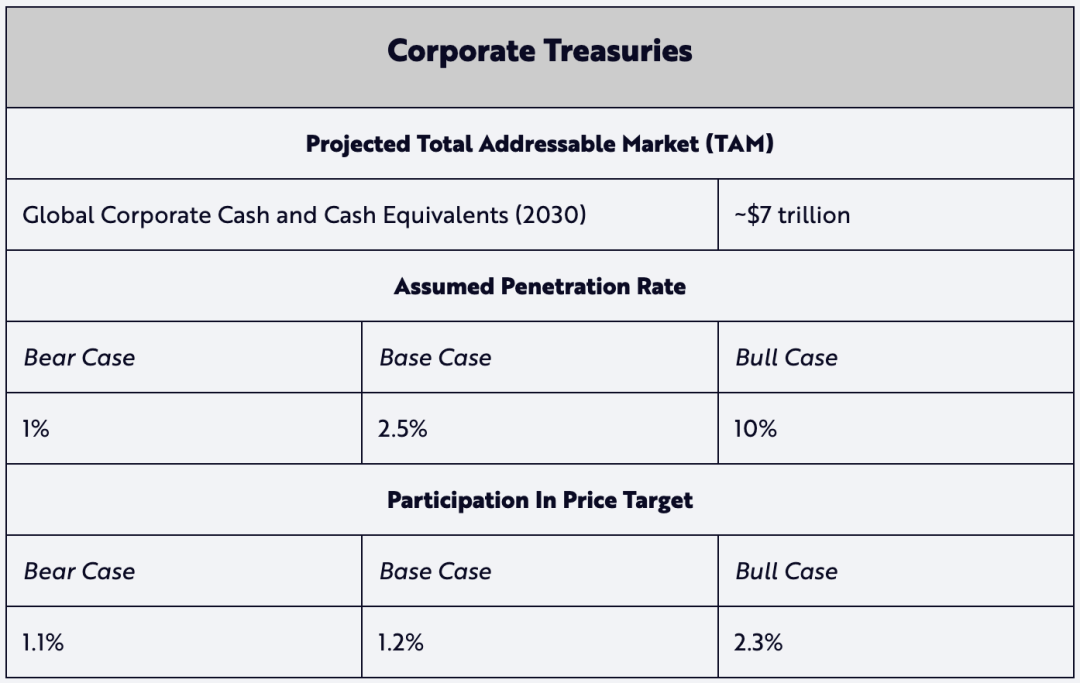
Inspired by Strategy's successful acquisition of Bitcoin since 2020, other companies have also included Bitcoin in their corporate treasury reserves. As of the end of 2024, 74 listed companies held approximately US$55 billion in Bitcoin on their balance sheets. If these corporate BTC strategies prove successful in the next six years, our conservative penetration assumptions in bear markets and benchmark scenarios (1% and 2.5%, respectively) may eventually approach 10% under the bull market assumption.
**6. Potential contributors to capital accumulation: Bitcoin on-chain
financial services**
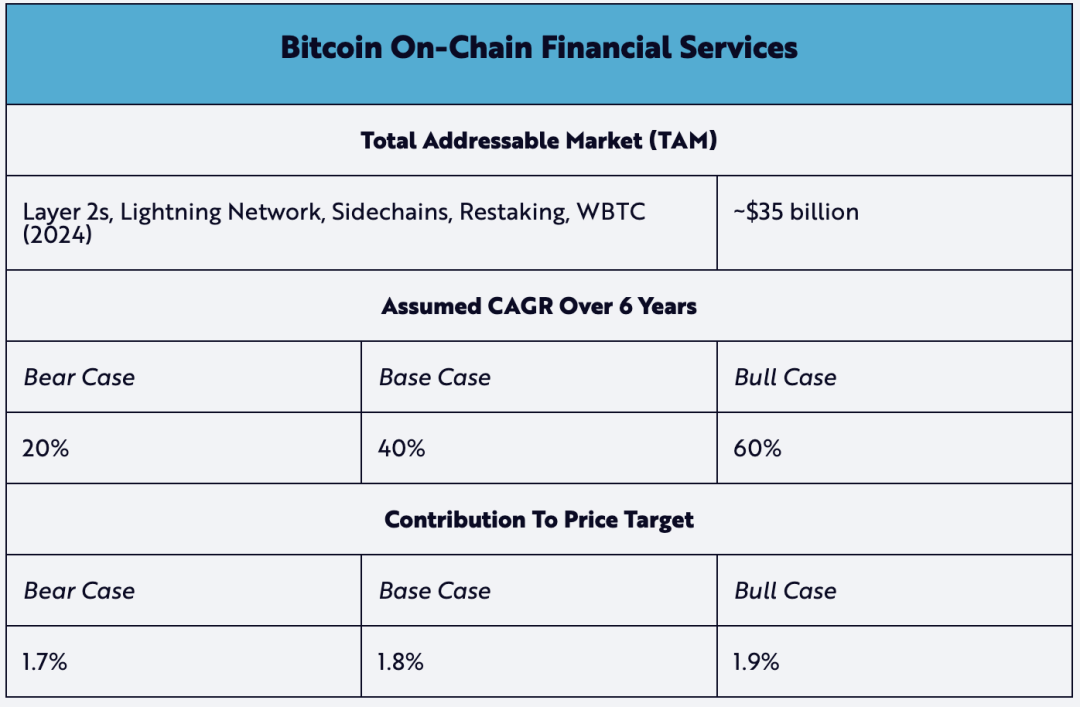
Bitcoin’s native financial services are becoming an emerging contributor to capital accumulation. Highlights include: Layer 2 services like Lightning Network are committed to expanding Bitcoin’s transaction capacity, while Wrapped BTC (WBTC) on the Ethereum network enables Bitcoin to participate in decentralized finance. Such on-chain financial services are becoming an increasingly important feature in the Bitcoin ecosystem. Therefore, we believe that the benchmark market's 40% compound annual growth rate is based on realistic expectations from now until 2030.
ARK's assumption applies to active Bitcoin supply
Although not included in ARK's Big Ideas 2025 report, other experimental modeling methods estimate the price of Bitcoin in 2030. One of them is to use the on-chain transparency of Bitcoin to estimate the liquidity supply of Bitcoin – what we call the “active” supply.
According to this approach, active supply can be calculated by multiplying the expected supply of Bitcoin in 2030 by the “activity” metric, which measures how much Bitcoin moves over time from 0% to 100%—in other words, the real “float” of assets, as shown below.
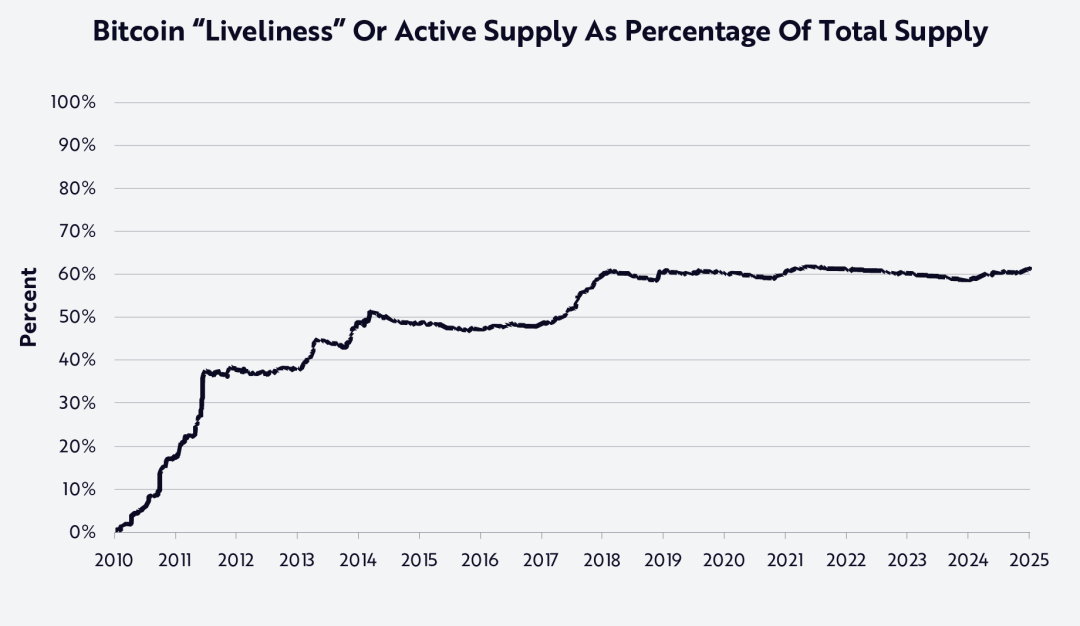
As shown in the figure, Bitcoin’s network activity has remained at around 60% since the beginning of 2018. We believe that this level of activity indicates that about 40% of the supply is “vaulted” (i.e., storing Bitcoin that does not enter the market, such as Satoshi’s Bitcoin address) – a concept we explored in depth in the ARK white paper Cointime Economics: A new framework for analysis on the Bitcoin chain (https://www.ark-invest.com/white-papers/cointime-economics).
We then apply TAM and penetration under the same bear market and benchmark markets to the expected active supply to reach 60% by 2030 (assuming activity remains stable over time) as follows:
On this basis, we come up with the following price targets, which are about 40% higher than our base model, which does not take into account Bitcoin active supply and network activity:
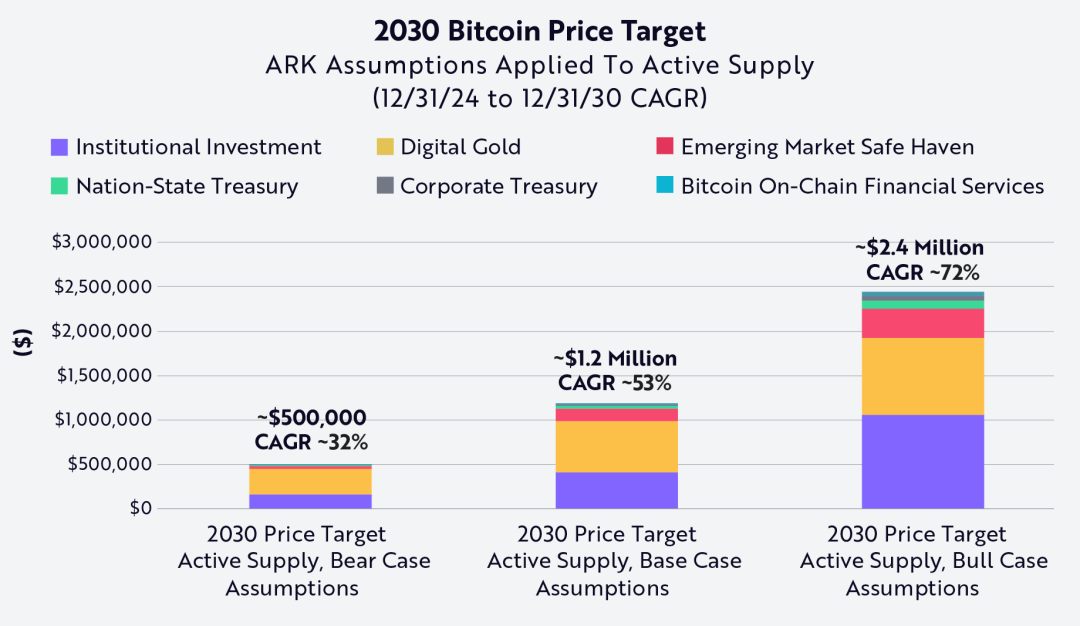
The model shows that the estimated BTC price in 2030 based on the addition of the new BTC indicator is: $500,000 (bear market), $1.2 million (benchmark market) and $2.4 million (bull market).
Importantly, valuations built with this more experimental approach are more radical than we do in bear, benchmark and bull scenarios. Since our official price targets are more conservative, we only focus on the total supply of Bitcoin. Even so, we believe that this more experimental approach highlights the scarcity and loss of supply of Bitcoin are not reflected in most valuation models today.
Extra
I took a rough look at the Cointime Economics framework, which proposes a new system to analyze Bitcoin valuation and inflation rates. By calculating Bitcoin's economic status and supply activities through Bitcoin's liveliness and storage (Vaultedness), it can measure the transaction activity in the Bitcoin network and the proportion of unused coins. These two indicators can be used to classify the supply of Bitcoin, which is divided into active supply and unused supply.
The framework also proposes a unit of measurement - "Coinblock". The concept of currency block provides a new set of on-chain analysis indicators to measure Bitcoin's activity. The number of currency blocks is obtained by calculating the product of the holding time and the number of Bitcoins. It also introduces three concepts: "Coinblock creation", "Coinblock destruction" and "Coinblock storage". Based on this, a series of new economic indicators are constructed, such as the activity and locking degree of Bitcoin, to measure the dynamic changes and economic status of the Bitcoin market. In addition, the content demonstrates the potential of Cointime Economics in improving market valuation models, measuring supply activities, and creating new models through case studies. The concept of coin blocks and the Cointime economic framework may become the main reference for Bitcoin valuation in the future. Interested friends can check out the original PDF (https://assets.arkinvest.com/media-8e522a83-1b23-4d58-a202-792712f8d2d3/c919760f-ddc5-4c7c-a653-7904c0f78ddf/ARK%20Invest%20x%20Glassnode_White%20Paper_Cointime%20Economics_Final.pdf).
