How does global liquidity influence Bitcoin trend?

Reprinted from panewslab
03/10/2025·2MAuthor: Bitcoin Magazine Pro
Compilation: Vernacular Blockchain

Bitcoin’s price trends are usually analyzed through on-chain data, technical indicators and macroeconomic trends. However, a severely underestimated but extremely important factor is Global Liquidity. Many investors may not take full advantage of this metric and even have misunderstandings about how it affects Bitcoin’s cyclical trends.
1. The impact of global liquidity on Bitcoin
As discussions on global liquidity on platforms such as Twitter (X) heat up and analysts’ in-depth interpretation of liquidity data, understanding the relationship between global liquidity and Bitcoin price has become a compulsory course for traders and long-term investors. However, recent trends deviate from traditional expectations, suggesting that the market may need a more nuanced analytical perspective.
Global M2 money supply refers to the sum of all liquid currencies, including cash, demand deposits and quasi-monetary assets that can be easily converted.
When global M2 expands, capital often flows to high-yield assets, including Bitcoin, stocks and commodities, driving prices up.
On the contrary, when M2 shrinks, market liquidity tightens, and risky assets often face pressure from decline in valuation.
In the current market environment, the traditional relationship between liquidity and asset prices may be changing, which puts higher understanding requirements for investors.
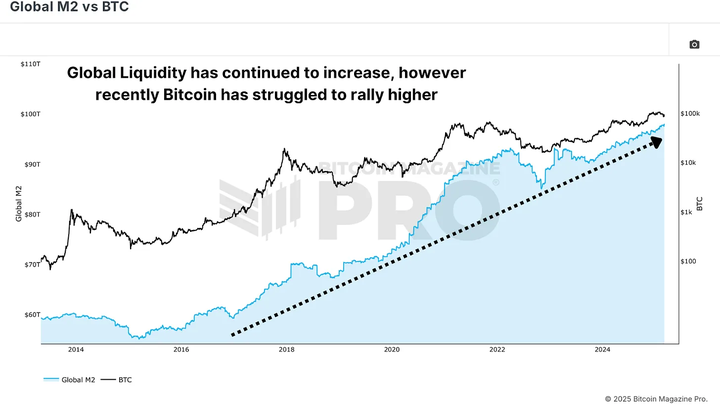
Figure 1: Global liquidity is rising, but Bitcoin price has fallen recently
Historical Trends: Difference between Bitcoin Price and Global M2 Trend
In the past, Bitcoin prices have typically risen with the expansion of global M2 money supply and are under pressure as liquidity shrinks. However, during this cycle, we observed a clear deviation: Bitcoin’s price trends showed inconsistency despite the continued growth of global M2.
2. Year-on-year changes: more accurate way to measure liquidity
Rather than simply focusing on the absolute value of global M2, a more insightful approach is to analyze its year-on-year change rate (YoY). This indicator reflects the rate of liquidity expansion or contraction, thus revealing a clearer correlation between Bitcoin price performance and liquidity.
When we compare Bitcoin’s YoY Return with the year-on-year change in M2 globally, we can find that the correlation between the two is significantly enhanced.
Bitcoin’s strongest bull market often occurs during periods of rapid liquidity expansion.
Liquidity contraction is usually ahead of the correction of Bitcoin price or long-term oscillation consolidation.
This finding suggests that investors need to pay more attention to changes in global liquidity growth, rather than just the absolute level of liquidity.
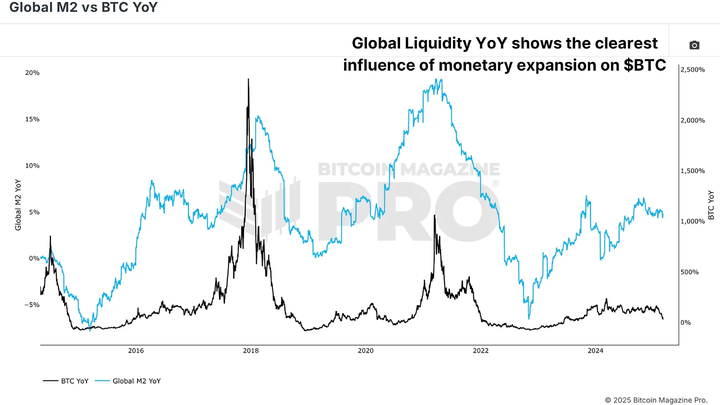
Figure 2: Annual variance rate of global liquidity can reveal liquidity cycles more clearly
For example, during the consolidation phase of Bitcoin in early 2025, global M2 has grown steadily, but its growth rate has stabilized. Only when the expansion speed of M2 is significantly accelerated can Bitcoin break through a new high.
3. The hysteresis effect of liquidity
Another key observation is that the impact of global liquidity on Bitcoin is not effective immediately. Research shows that Bitcoin’s price usually lags behind changes in global liquidity by about 10 weeks.
If the global liquidity indicator is moved forward for 10 weeks, the correlation between Bitcoin's price trend and its correlation will be significantly enhanced.
After further optimization, it was found that the most accurate lag period was about 56 to 60 days, that is, about 2 months.
This lag effect means that investors need to consider time delays when analyzing the impact of liquidity on Bitcoin, rather than just focusing on current liquidity levels.
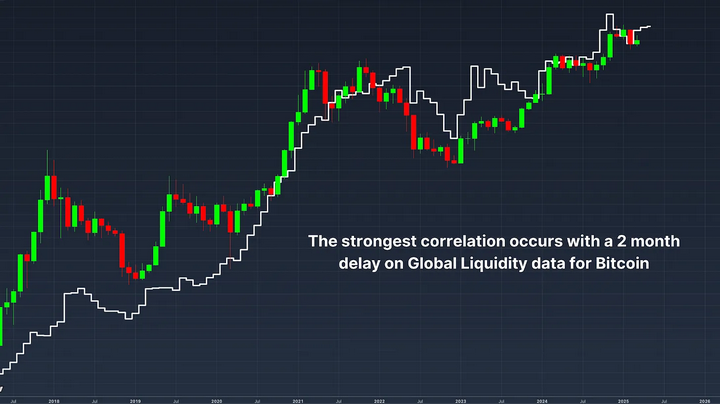
Figure 3: The strongest correlation when liquidity data lags behind for two months
4. Bitcoin Outlook
Global liquidity entered a sideways phase for much of 2025, after a strong expansion at the end of 2024 pushed Bitcoin to a new high. This liquid sideways period happens to be synchronized with Bitcoin’s consolidation and correction to about $80,000.
However, if the historical trends continue to work, the recent rebound of global liquidity is expected to bring a new round of gains to Bitcoin around the end of March.
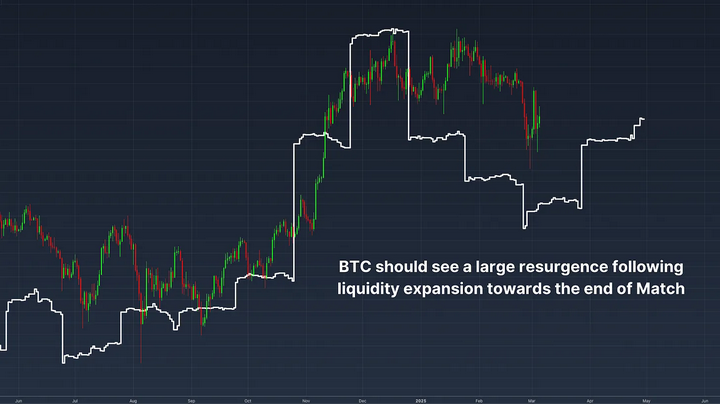
Figure 4: Liquidity is booming, but Bitcoin may take weeks to really benefit
5. Conclusion
Global Liquidity is an important macro indicator for predicting Bitcoin trends. However, rather than relying on static M2 data, a more effective approach is to focus on the rate of change in M2 and understand the impact of Bitcoin prices typically lag around two months.
With the changes in the global economic environment and central banks adjusting monetary policies, the price of Bitcoin will still be affected by liquidity trends. The next few weeks are crucial – if global liquidity continues to expand at a faster pace, Bitcoin may usher in a major market.