Grayscale Report: Decoding the crypto bull market cycle, how long can the market continue to rise?
Reprinted from chaincatcher
12/23/2024·5MOriginal title: "The State Of the Crypto Cycle"
Author:Zach Pandl & Michael Zhao
Compiled by: Shenchao TechFlow
-
Historically, cryptocurrency valuations have typically followed a clear four-year cycle, with prices experiencing consistent phases of rise and fall. Grayscale Research believes that investors can track the cyclical changes in the cryptocurrency market and optimize risk management strategies by monitoring a series of blockchain-based indicators and other data.
-
As cryptocurrencies become a mature asset class, the market is changing significantly. For example, after the launch of spot exchange-traded products (ETPs) for Bitcoin and Ethereum, the threshold for investors to enter the market has been further lowered. Meanwhile, the new U.S. Congress is likely to bring a clearer regulatory framework for the industry. Based on these factors, cryptocurrency valuations may gradually move away from the four-year cycle pattern that has been recurring in earlier history.
-
Nonetheless, Grayscale Research believes that current market indicators indicate that the cryptocurrency market is in the middle of the cycle. As long as this asset class remains supported by fundamental factors, such as expanding application scenarios and a stable macroeconomic environment, the bull market is likely to continue into 2025 and beyond.
Similar to many physical commodities, Bitcoin’s price does not exactly follow a “random walk” pattern. Instead, the data shows a statistical momentum effect on its prices: Uptrends tend to persist for a while, while downtrends also continue. Over a longer period of time, this cyclical fluctuation in Bitcoin prices shows repeated rises and falls around a long-term upward trend (see Figure 1).
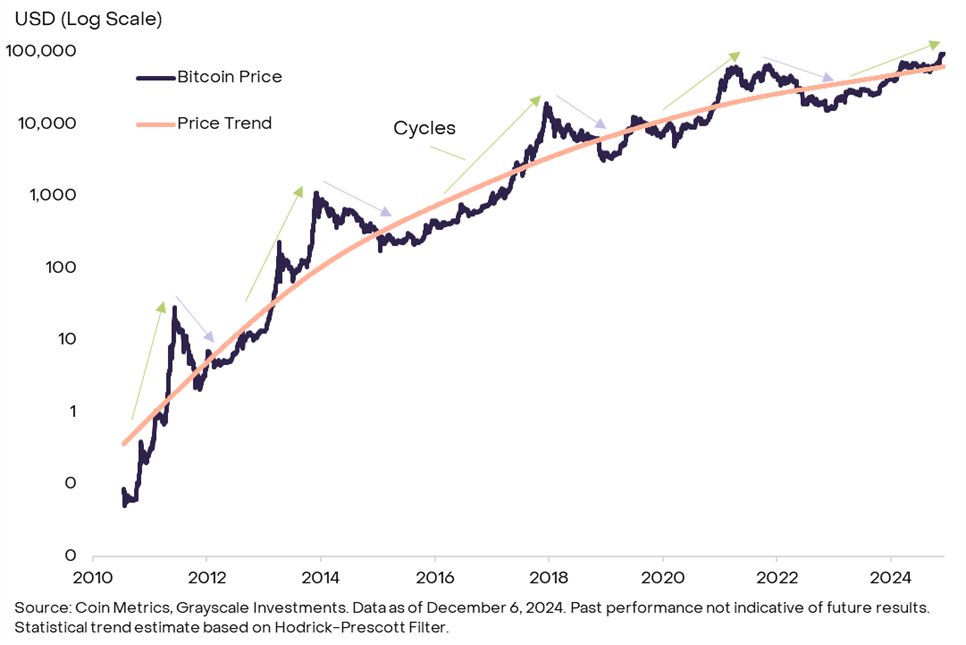
Figure 1: Bitcoin price cyclical fluctuations around a long-term uptrend
Each past price cycle has had its own unique drivers, so future price performance will not exactly replicate past experience. In addition, as Bitcoin matures and is accepted by more traditional investors, and the impact of the four-year halving event on supply gradually weakens, the cyclical fluctuations in Bitcoin prices may change or even disappear. Still, studying past price cycles can provide investors with a reference to help them understand Bitcoin’s typical statistical properties and thus better manage risk.
A measure of momentum
Figure 2 shows the price performance of Bitcoin during the rising phase of each cycle. For ease of comparison, prices are normalized to 100 starting from the cycle low (i.e. the start of the up phase) and traced to its peak (i.e. the end of the up phase). Figure 3 presents the same data in tabular form.
Early price cycles in Bitcoin's history were relatively short and steep: the first lasted less than a year, and the second lasted about two years. In both cycles, prices increased more than 500-fold from the previous cycle's lows. The two subsequent cycles lasted less than three years each. In the cycle from January 2015 to December 2017, the price of Bitcoin increased by more than 100 times, and in the cycle from December 2018 to November 2021, the price of Bitcoin increased by about 20 times.

Figure 2: Current Bitcoin price trends are relatively close to the last two market cycles
After peaking in November 2021, Bitcoin prices fell to a cyclical low of approximately $16,000 in November 2022. Since then, Bitcoin has entered a new round of price increases that have lasted for more than two years. As shown in Figure 2, the recent upward price trend is similar to that of the two previous Bitcoin cycles, both of which lasted about a year before reaching a price peak. Judging from the increase, the price return of Bitcoin during this cycle is approximately 6 times. Although this increase cannot be underestimated, it is significantly lower than the return rate of the past four cycles. Overall, while we cannot be sure whether future price performance will repeat past patterns, Bitcoin’s history suggests that this bull market may still have room to go further in terms of duration and magnitude.

Figure 3: Four unique cycles in Bitcoin price history
Analysis of key indicators
In addition to assessing the price performance of past cycles, investors can judge the maturity of the current Bitcoin bull market through a variety of blockchain-based indicators. These indicators typically include: the increase in Bitcoin price relative to a buyer's cost benchmark, the size of new capital inflows into the Bitcoin market, and the ratio of Bitcoin price to miner revenue.
One of the commonly used indicators is the MVRV ratio, which is the ratio of Bitcoin’s market value (MV) (each Bitcoin is calculated based on the current market price) and its realized value (RV) (each Bitcoin is calculated based on the last transaction price on the chain). Compare. The MVRV ratio can be understood as the premium of Bitcoin’s market value relative to the market’s total cost benchmark. Over the past four cycles, the MVRV ratio has reached levels of at least 4 (see Figure 4). Currently, the ratio stands at 2.6, suggesting there may be room for further gains in the current cycle. However, the MVRV ratio gradually decreases at the peak of each cycle, so the price may have peaked before the indicator reached 4.

Figure 4: MVRV ratios are currently mid-range
Other on-chain indicators focus on new money entering the Bitcoin ecosystem, often referred to as HODL Waves by veteran cryptocurrency investors. This framework suggests that the price increase may be due to new money buying Bitcoin from long-term holders at slightly higher prices. Grayscale Research prefers to measure this using the ratio of the number of Bitcoins moved on-chain over the past year to the total circulating supply (see Figure 5). In the past four cycles, this ratio has reached at least 60%, which means that at least 60% of the circulating supply occurred on-chain transactions within a year of the up phase. Currently, this ratio is around 54%, indicating that there may be more Bitcoin changing hands on the chain before the price peaks.

Figure 5: Less than 60% of Bitcoin’s active circulating supply over the past year
Additionally, there are cyclical indicators that focus on the behavior of Bitcoin miners, the core players responsible for maintaining the security of the Bitcoin network. For example, a common metric is the ratio of miner asset value (MC) to “thermal capital” (TC). Intuitively, when the Bitcoin assets held by miners reach a certain critical value, they may choose to take profits. Judging from historical data, when the MCTC ratio exceeds 10, Bitcoin prices tend to peak in that cycle (see Figure 6). Currently, the MCTC ratio is around 6, which suggests that the current cycle may still be in the middle of the cycle. However, similar to the MVRV ratio, the MCTC ratio gradually decreases at the peak of each cycle, so the price may have peaked before the indicator reached 10.

Figure 6: Bitcoin miner-based metrics are also currently below historical thresholds
There are many types of on-chain metrics, and there may be slight differences in measurements between different data sources. In addition, these tools can only provide a rough comparison of the current phase of price increases with the past, and there is no guarantee that the relationship between these indicators and future price movements will be fully consistent with historical patterns. Still, taken together, common indicators of the Bitcoin cycle remain below levels seen at past price peaks, suggesting the current bull run may continue if fundamentals hold up.
Look beyond Bitcoin
The scope of the crypto market extends far beyond Bitcoin, and signals from other areas of the industry can equally provide clues to the state of the market cycle. We believe these signals may be particularly critical in the year ahead due to Bitcoin’s relative performance against other cryptoassets. Over the past two market cycles, Bitcoin dominance (i.e., Bitcoin’s share of total crypto market capitalization) typically peaked two years after the start of a bull market (see Figure 7). Recently, Bitcoin dominance has begun to decline, a trend that is once again occurring around the two-year point of the market cycle. If this trend continues, investors should look more broadly to other indicators to determine whether cryptocurrency valuations are approaching cyclical highs.
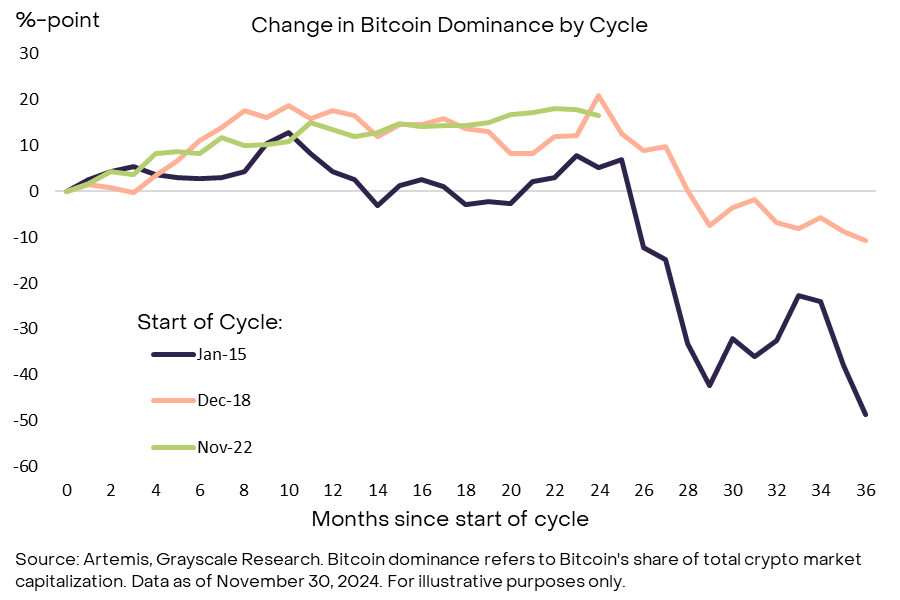
Figure 7: Bitcoin dominance declines in third year of past two cycles
For example, investors can focus on funding rates (i.e., the cost of holding a long position in perpetual futures contracts). When speculative traders' demand for leverage increases, funding rates tend to rise. Therefore, the level of funding rates can reflect the overall level of speculative long positions in the market. Figure 8 shows the weighted average funding rates for the 10 largest crypto-assets (i.e. altcoins) outside of Bitcoin. Funding rates are currently positive, indicating higher demand for long positions from leveraged investors, although funding rates fell during last week's market correction. Furthermore, even at its local highs, current funding rate levels remain below the peaks seen earlier this year and in the previous cycle. Therefore, we believe that current funding rate levels reflect moderate levels of speculative long positioning in the market and do not necessarily mean that the market cycle has entered its end.
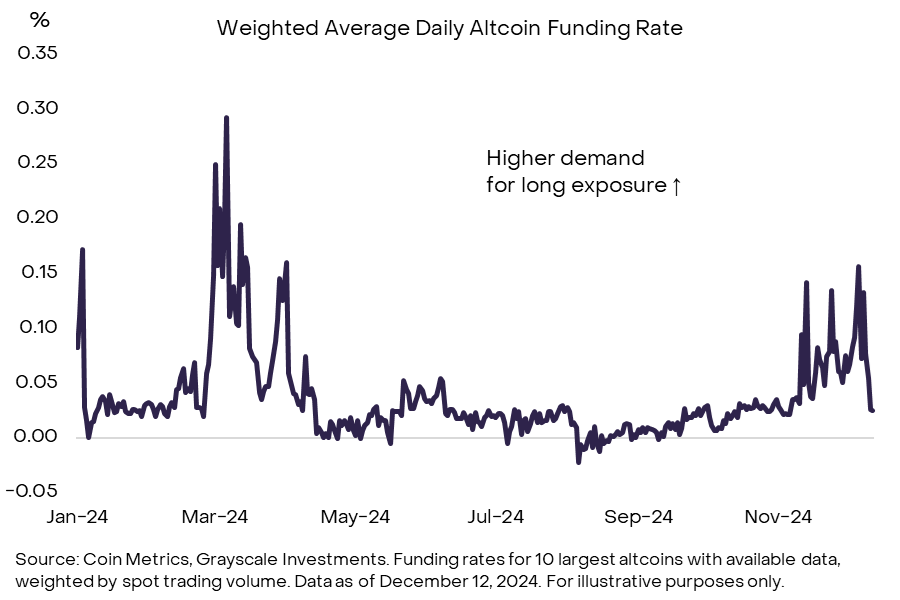
Figure 8: Altcoin funding rates show moderate levels of speculative long positions
In comparison, altcoin perpetual futures open interest has reached relatively high levels. Prior to the massive liquidation event on December 9, altcoin open interest reached nearly $54 billion across the three major perpetual futures exchanges (see Figure 9). This indicates the larger size of speculative long positions in the market. After a massive liquidation earlier this week, altcoin holdings fell by around $10 billion but remain at elevated levels. Typically, high levels of speculative long positions signal the later stages of a market cycle, so this indicator deserves continued attention.
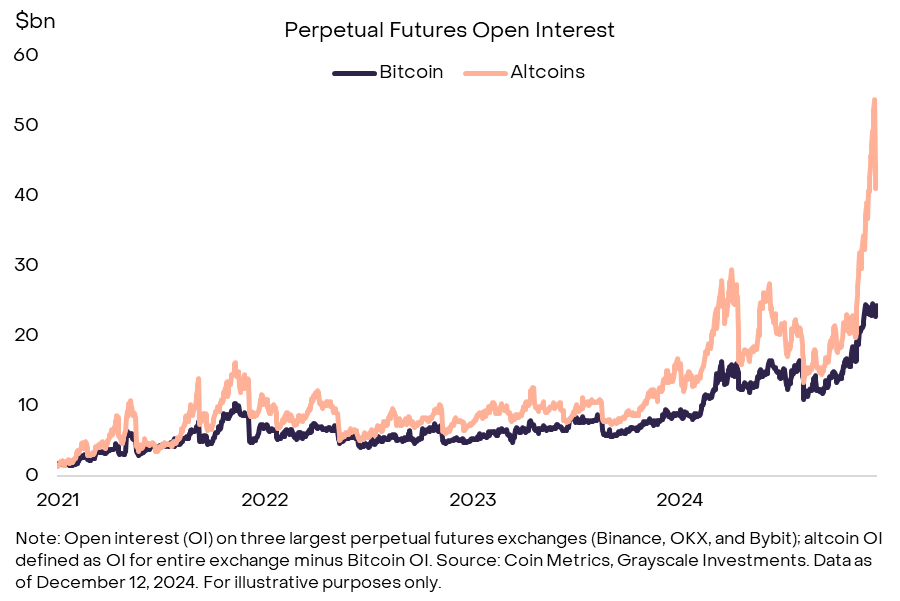
Figure 9: Altcoin holdings reached high levels before recent liquidations
The market is still developing
The digital asset market has made significant progress since the birth of Bitcoin in 2009, and the current crypto bull market has many differences compared to the past. The most significant change was the approval of Bitcoin and Ethereum spot exchange-traded products (ETPs) in the United States, which brought $36.7 billion in net capital inflows to the market and incorporated these assets into more traditional investment portfolios. Additionally, the recent U.S. elections may bring a clearer regulatory framework to the market and solidify digital assets’ place in the world’s largest economy — a stark contrast to the past, which has seen repeated questions about the long-term prospects of crypto assets. For these reasons, the valuations of Bitcoin and other cryptoassets may no longer follow the four-year cycle pattern that recurred throughout their early history.
At the same time, Bitcoin and many other crypto-assets can be considered digital commodities, similar to traditional commodities, and their prices may exhibit certain momentum effects. Therefore, the analysis of on-chain indicators and altcoin position data is of great significance to investors in making risk management decisions. Grayscale Research believes that the current combination of indicators is consistent with the middle stage of the crypto market cycle: for example, the MVRV ratio is significantly above its cyclical lows, but has not yet reached the levels of previous market tops. The bull market is likely to continue as long as fundamentals, such as adoption of the app and broader macroeconomic conditions, are supportive.

 panewslab
 jinse
jinse