
Glassnode: What made SOL soar 2143% in the past two years?

Reprinted from jinse
12/27/2024·5MAuthor: UkuriaOC, CryptoVizArt, Glassnode; Compiler: Bai Shui, Golden Finance
summary
-
Since the cycle low in November 2022, Solana has outperformed Bitcoin and Ethereum as measured by price appreciation and relative capital inflows.
-
Sustained positive capital inflows resulted in a $55 billion increase in net liquidity, providing a significant boost to price appreciation.
-
Despite significant profit-taking and distributions, Solana investors have not yet reached the point of unrealized profitability (paper gains) that has historically coincided with longer-term macro tops, suggesting there is room for further growth throughout the cycle.
SOL, BTC, ETH comparison
Over the past 4 years, Solana has attracted significant interest and attention from investors and market speculators. Initially, the asset saw huge growth during the 2021 bull run, but then faced major challenges following the FTX collapse, which resulted in a severe oversupply.
After plunging to astonishing lows of $9.64, Solana has staged a remarkable recovery, posting impressive growth of 2,143% over the past 2 years. This impressive price performance has seen Solana outperform Bitcoin and Ethereum on 344 out of 727 trading days since the FTX incident, indicating substantial growth and demand for the asset.
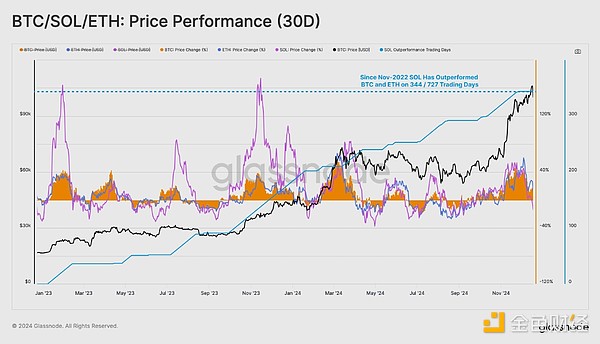
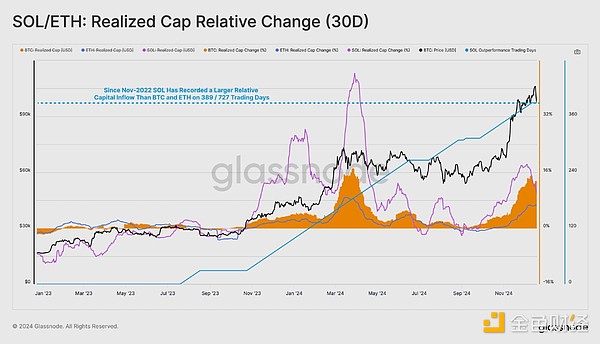
The surge in price action has also attracted significant new capital into the asset. We can use the relative realized cap changes of Solana, Bitcoin, and Ethereum as a metric to evaluate and compare capital flows into each network.
Since its December 2022 lows, Solana has seen a much higher percentage capital growth than Bitcoin and Ethereum in 389/727 trading days, highlighting the significant growth in its liquidity.
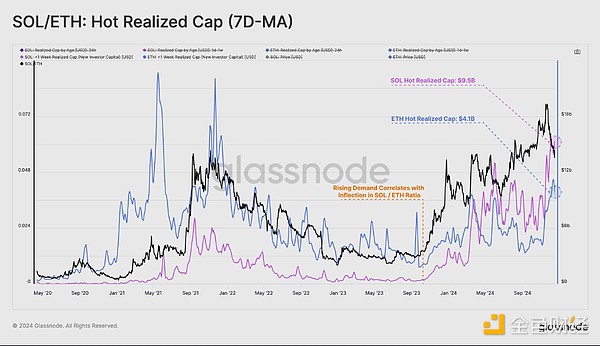
To assess demand-side momentum, we can track capital inflows from new investors, which is known as the "hot realized cap." This indicator measures the capital held by active accounts over the past seven days.
When comparing the scale of new capital entering the asset between Solana and Ethereum, we can observe that Solana’s new investor demand exceeded that of Ethereum for the first time in history, highlighting its strong demand profile.
Notably, Solana’s popular realized cap rose sharply ahead of early 2024, marking an upward inflection point for the SOL/ETH ratio, with an influx of new capital fueling growth.
Exploring SOL Capital Flows
Having established Solana's outperformance relative to other major assets, we'll now examine the size and composition of Solana's capital flows.
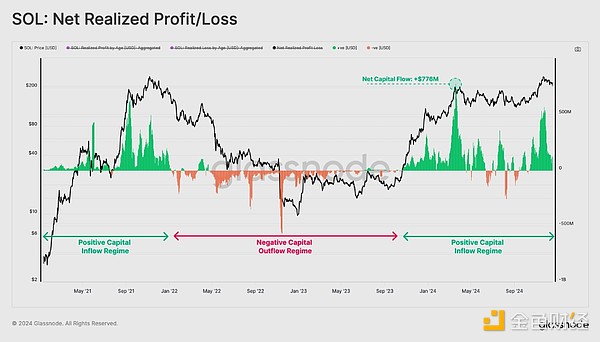
By evaluating the Net Realized Profit/Loss metric, we can visualize daily changes in capital flows on the Solana chain. When this indicator is positive, it represents net capital creation (currency trading gains); when the indicator is negative, it represents net capital creation (currency trading losses).
We observe that Solana has maintained positive net capital inflows since early September 2023, with only minor capital outflows during this period. Continued inflows of liquidity helped spur economic growth and price appreciation, reaching a staggering peak of $776 million in new capital inflows per day.
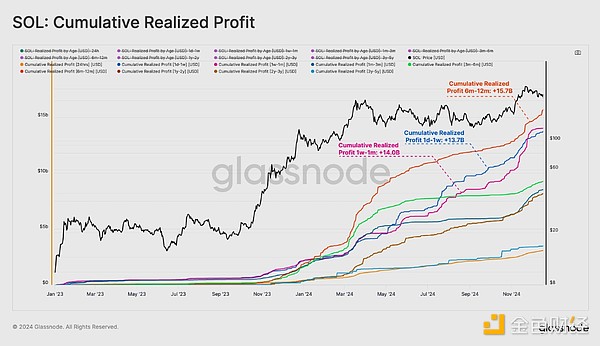
We can use the Coin Age breakdown of the Realized Profit metric to assess which subgroups contribute the most to seller pressure. Here, we calculate the cumulative profit-taking volume since the beginning of January 2nd by coin age.
-
24 hours: $3.1 billion
-
1 day-1 week: $13.7 billion
-
1 week-1 month: $14 billion
-
January-March: $8.5 billion
-
June-December: $15.7 billion
-
Years 1 to 2: $8.2 billion
-
Years 2 to 3: $8.2 billion
-
3 to 5 years: $3.5 billion
Notably, coins aged 1 day-1 week, 1 week-1 month, and 6-12 months were significant contributors to seller pressure, with each coin recording sizable profits. Together they account for 51.6% of realized profits, showing a balanced distribution of market influence. This underscores the idea that Solana, as an asset, is viewed as an investment opportunity for all types of investors.
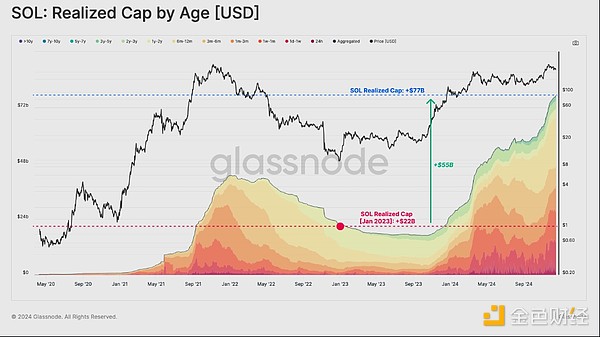
Over the same period, massive capital inflows allowed Solana to accumulate more than $55 billion in U.S. dollar liquidity, increasing the realized cap from $22 billion to a staggering $77 billion.
Is the SOL market overheated?
In the previous section, we assessed significant profit taking and supply allocation, so it became prudent to assess the extent of market overheating.
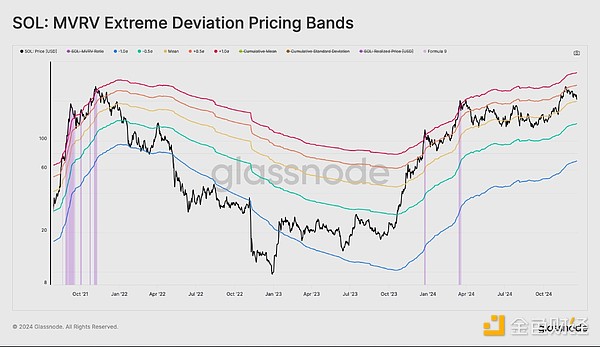
To do this, we can use the MVRV ratio to define pricing bands to assess extreme deviation points in investor profitability relative to the long-term average. Historically, a break above 1 standard deviation has been consistent with forming a long-term macro top.
Currently, SOL price is consolidating between the mean and +0.5 standard deviation range. This suggests that the market is relatively hot, but it also suggests that there may be further room to run before profits held by ordinary investors reach the extreme range of +1σ, triggering a flurry of profit-taking and distributions.
Summarize
With the release of the new segmented indicator, we are able to analyze investor behavior during dynamic markets for the Solana asset for the first time, providing important information on the mechanisms of capital creation and destruction.
Solana's rapid recovery and subsequent price rise has been impressive, and it has managed to raise significant funding from both institutional and retail investors.


 panewslab