Glassnode: How does currency age affect Bitcoin’s buying and selling patterns?

Reprinted from jinse
12/18/2024·6MAuthor: Mario Schröck, Glassnode; Compiler: Tao Zhu, Golden Finance
Preface
Bitcoin’s transparent blockchain allows for detailed analysis of token movements and holder behavior. By examining the age of unspent transaction outputs (UTXOs) and their probability of being spent, we can gain insight into the dynamics of the Bitcoin ecosystem. This article explores the power law relationship between UTXO time limits and the probability of buying and selling, revealing predictable patterns in how tokens are held and bought and sold over time.
Why this analysis is important
Understanding Bitcoin’s UTXO spending behavior provides powerful insights to traders, investors, and analysts alike. By uncovering the predictable patterns that govern currency dormancy, you can:
-
Enhance investment strategies: Anticipate potential liquidity changes and better gauge market sentiment.
-
Improving on-chain analysis: utilizing mathematical frameworks to supplement traditional LTH/STH indicators.
-
Predicting holder behavior: Determining when a token is likely to re-enter circulation, informing the timing of transactions or decisions.
Whether you're optimizing trading algorithms, analyzing market trends, or refining your investment approach, this framework can give you a clear, data- driven edge in the Bitcoin ecosystem.
What are UTXOs and payout probability?
The core of the Bitcoin blockchain is the UTXO model. UTXO stands for Unspent Transaction Outputs – essentially Bitcoin blocks that have been received but not yet spent. Every Bitcoin transaction consumes an existing UTXO as input and creates a new UTXO as output. These UTXOs can be thought of as tokens stored at a specific address, waiting to be used in future transactions.
By analyzing the age of these UTXOs (number of days since creation), we can infer behavioral patterns of holders in the network. A fundamental concept in this analysis is spend probability, which measures the likelihood that a UTXO at a given time will be spent on any given date. This metric quantifies how Bitcoin moves within the ecosystem and how holder behavior evolves.
methodology
Dataset and UTXO Count
Our analysis is based on Bitcoin UTXO data from 2015 to November 2024. For each day during this period, we calculated the number of UTXOs for each possible currency age, from one day to 10 years (approximately 3,650 days). We limit the maximum coin age to 10 years to avoid the noise inherent in extremely old UTXO data.
Calculate payout rate
To determine payout probability, we compare the number of UTXOs of a specific age on one day to the number of UTXOs of the next higher age the next day. The consumption part is calculated as follows:
Spending score = 1 - (the number of UTXOs with a currency age of N in T days) / (the number of UTXOs with a currency age of N-1 in T-1 days)
This formula represents the proportion of UTXOs with age N-1 that do not appear as UTXOs with age N the next day, meaning they have been spent.
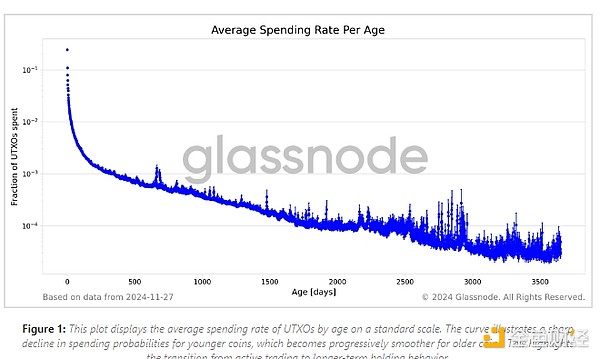
We then calculate the average spending rate for each age group across the entire data set, along with the standard error of the mean. Figure 1 visually shows the average payout rate by coin age.
Power law dynamics in log-log space
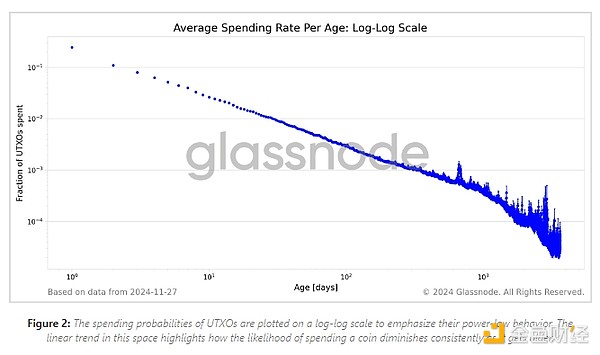
To better understand the relationship between UTXO age and payout rate, we plotted the data in log space. This transformation is beneficial because the power law relationship appears as a straight line in log-log space, making it easier to identify and analyze. Figure 2 shows a log-log plot of spending rates.
Fitting a power law
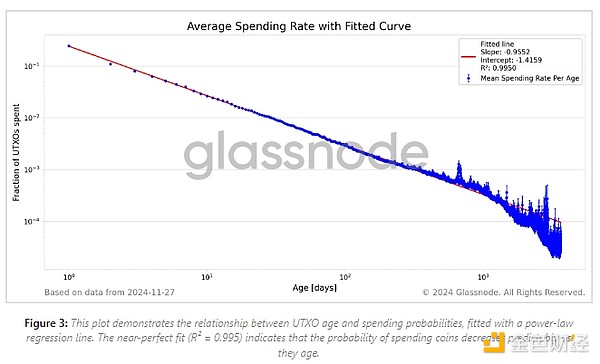
We performed linear regression on log-log data to quantify the power law relationship. We use weighted least squares for regression, with weights proportional to the square of the UTXO count divided by the square of the standard error of the mean. This weighting takes into account changes in the reliability of data points due to differences in sample size and variance.
The slope of the regression line corresponds to a power law exponent, indicating how quickly the probability of consumption decreases with age. Figure 3 shows the fitted regression.
Analyze residuals to assess fit quality
To assess the quality of the power law fit across coin age groups, we analyzed the residuals, which are the differences between the observed average spending rates and our model predictions. Plotting the residuals helps us identify patterns or systematic deviations of the model. Figure 4 shows the residual as a function of UTXO currency age.
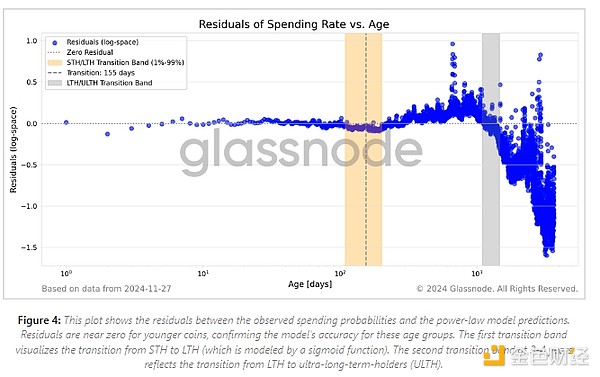
We observe minimal residuals for UTXOs around 200 days old, indicating a high predictability for this cohort. This is consistent with the gradual transition from short-term holders (STH) to long-term holders (LTH). The sigmoid function models this transition to obtain a smooth transition in the holder's behavior. The center point of this transition is the 155-day mark, which represents a 50-50 split between STH and LTH classifications. At about 200 days, the conversion from STH to LTH was 99% complete.
Our analysis shows that the power law model fits STH tokens almost perfectly until they fully transition to LTH. The model still holds up well (with smaller deviations) for LTH tokens that are 3-4 years old (second transition zone). These deviations suggest that the probability of spending for the medium-term LTH group is slightly higher than predicted by the model.
However, for ultra-long-term holders (ULTH)—coins beyond approximately one halving cycle—we observe a more significant deviation from the model. Specifically, the observed probabilities of spending are lower than those predicted by the power law. This indicates a greater propensity to hold these coins, possibly due to strong holding belief or the possibility of some of these coins being lost.
Power law over time
We look at another angle to examine whether the power-law dynamics of token payout probabilities change over time. Instead of averaging the UTXO count per coin age across all dates, we track groups of UTXOs born on the same day. Based on these date groups, we can analyze how the coin’s spending rate evolved at different times in Bitcoin’s history.
For each group, we calculate the consumption rate daily as the group’s currency age increases. We then performed a linear regression on the log-log probability of spending for each group separately. Ignoring data groups whose most recently recorded survival time was less than 10 days resulted in approximately 3600 remaining groups and corresponding linear regression.
The coefficient of determination (R2) for each regression indicates how well the power law model fits the data for that cohort. The slope of each line gives us an idea of how quickly the consumption rate decreases as the coin ages. Figure 5 plots the R2 value and line slope over time for each date group.
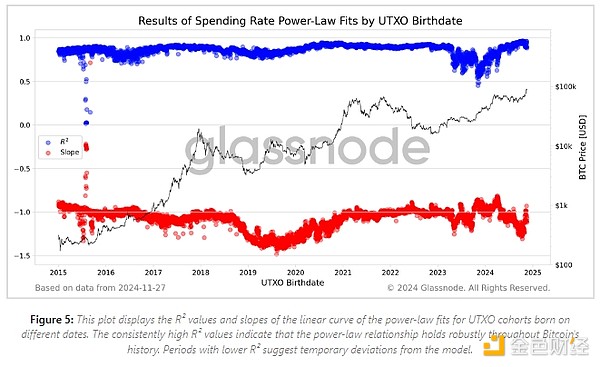
Overall, the power law holds well across dates, confirming the consistency of this dynamic over time. However, specific periods exhibit lower fit quality, although there is no clear correlation with price movements during these periods. We observe an early extension of spending probabilities (smaller slope values) throughout 2019. One possible explanation is that investors who bought when ATH fell -80% in 2017 were investing for the long term and, therefore, had a higher than normal payout rate.
Impact on on-chain analytics
These findings provide an ongoing perspective on coin age and payout probability, complementing existing LTH/STH frameworks. The power law relationship reflects the gradual transition from active trading to long-term holding.
Notably, the model fits younger coins almost perfectly, and still holds up well (with only a small deviation) for coins around four years old. Beyond this coin age, the model's biases become more significant, suggesting that other factors may influence the spending behavior of very long-term holders.
A power law with a slope close to 1 provides a clear and intuitive rule of thumb: for every tenfold increase in a token's lifetime, its probability of being spent decreases approximately tenfold. This is illustrated by the approximate model values in the table below:
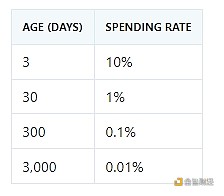
This predictable decay in payout probability highlights a pattern of behavior where younger coins are actively traded or speculated on, while older coins become increasingly dormant over time. By taking this ongoing perspective, analysts and investors gain a richer understanding of the gradual decline in spending activity as tokens age, enhancing interpretation of on-chain data and investor behavior.
Quantitative heat supply assumptions
Given our data, we evaluate a simple prediction heuristic:
If the UTXO is less than 7 days old, it is assumed that the UTXO will be used that day. Otherwise, assume it won't be spent.
Using historical data, this heuristic achieves an accuracy of 98%, indicating that it correctly predicts whether a UTXO will be spent in the vast majority of cases. However, high-precision numbers can be somewhat misleading due to the imbalance of the data set - there are a large number of unspent UTXOs on any given day.
Summarize
Our analysis shows that Bitcoin UTXO spending behavior is governed by a strong power law dynamic, with older tokens gradually becoming less likely to be spent. The power law relationship fits younger coins almost perfectly, and still holds up well (with only a small deviation) for coins up to four years old. For very long-term holders beyond this coin age, the deviation from the model becomes even more pronounced, suggesting that payout probabilities are even lower than predicted by the model. This suggests that other factors, such as strong holding beliefs or lost tokens, influence the spending behavior of these oldest UTXOs.
This finding enhances the existing LTH/STH framework by providing a sequential mathematical perspective on the gradual shift from active trading to long-term holding. The power law provides a precise rule of thumb: for every ten-fold increase in a token 's lifetime, its probability of being spent decreases approximately ten-fold. This predictable decay in payout probability provides valuable insights into investor behavior and token dormancy over time.
As Bitcoin continues to evolve, the power law model provides a mathematically based framework for on-chain analysis, enabling a deeper understanding of UTXO life cycle dynamics.

 panewslab