
Glassnode chain's weekly report: The macro environment is still unclear, and most of the losses are new investors

Reprinted from panewslab
04/18/2025·1MAuthor: Glassnode
Compiled by: Felix, PANews
Important points
- The macroeconomic environment remains unclear and global trade relations are undergoing restructuring. This uncertainty has exacerbated volatility in U.S. Treasury and stock markets.
- Against a challenging economic backdrop, Bitcoin hit its biggest drop since this cycle. Despite this, the decline is still within the range of previous bull market corrections. In addition, the median decline in this cycle is still one order of magnitude lower than the previous bull market, highlighting that demand is more resilient.
- The liquidity of the entire digital asset ecosystem continues to tighten, reflected in the decline in capital inflows and the stagnation of stablecoin growth.
- Investors are under tremendous pressure and are currently facing the largest unrealized losses ever. However, most of these losses are concentrated on new market participants, while long-term holders generally remain profitable.
Macro uncertainty remains widespread
The uncertainty of the macroeconomic outlook is increasingly prominent as the Trump administration tries to subvert and reorganize global trade relations. Currently, U.S. Treasury bonds are collateral and foundations of the financial system, and 10-year Treasury bonds are considered as the benchmark risk-free interest rate.
A key government goal is to lower the yield on 10-year Treasury bonds and have achieved initial results in the first few months of the year, with yields falling to 3.7% as the market sells out widely. However, this situation was fleeting, with yields then soaring to 4.5%, erasing the decline and causing huge volatility in the bond market.
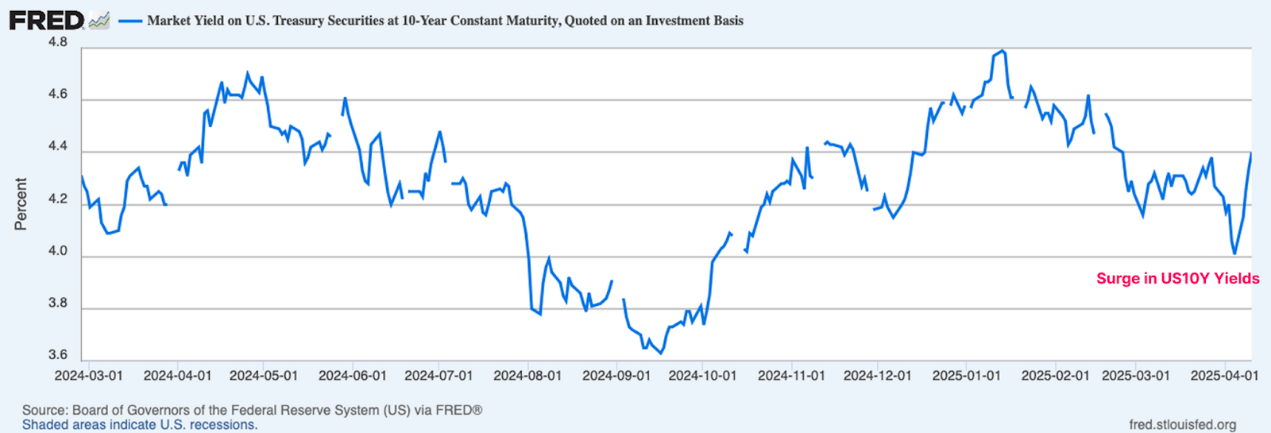
Source: FRED
The chaotic behavior of the bond market can be quantified through MOVE. This indicator is a key measure of pressure and volatility in the bond market, and is derived from the 30-day implied volatility of the U.S. Treasury market based on the price of options for different maturity.
As measured by this indicator, the sharp rise in volatility of U.S. Treasury bonds highlights the extreme uncertainty and panic among investors in bond markets.
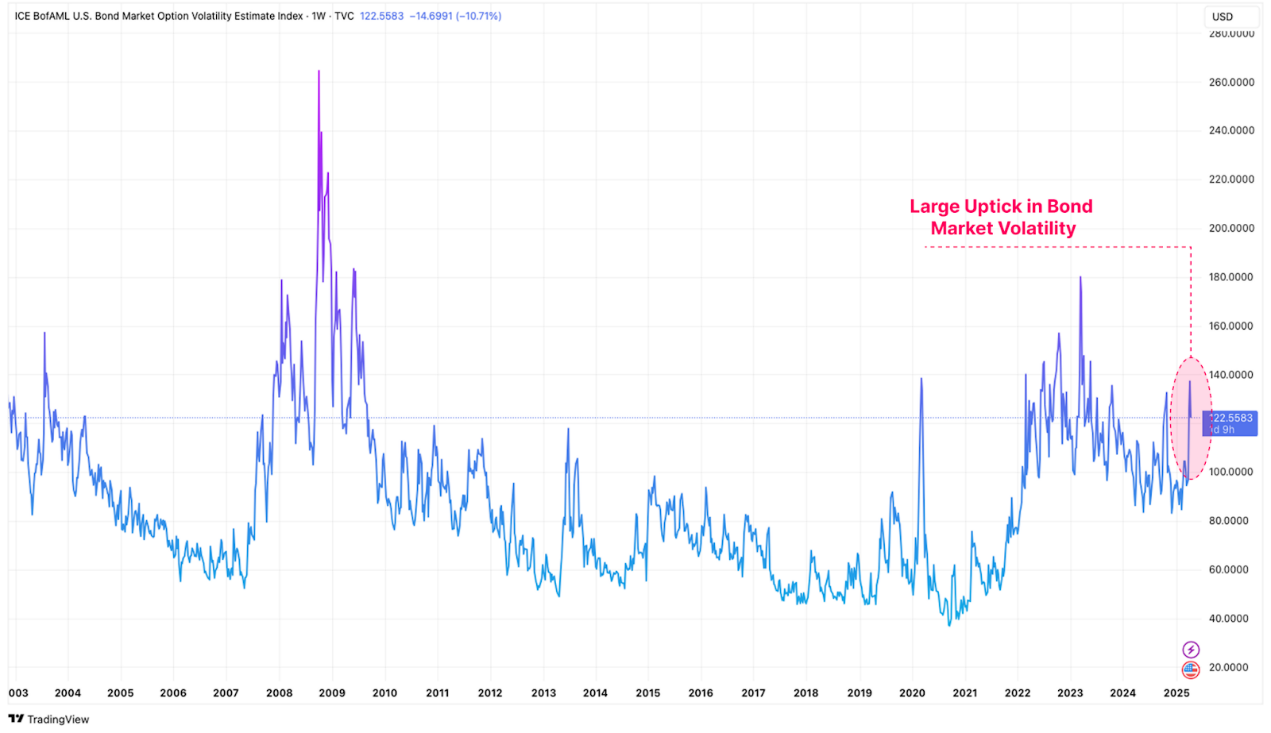
Source: Tradingview
In addition, the level of turmoil in the U.S. stock market can also be measured using the Volatility Index (VIX), which measures market expectations of 30-day volatility in the U.S. stock market. The volatility of the bond market is also significantly reflected in the stock market, and VIX's current volatility is similar to the volatility values during the 2020 COVID-19 crisis, the 2008 global financial crisis and the 2001 Internet bubble period.
Volatility in the underlying collateral of the financial system often leads to capital retracement among investors and tightening of liquidity conditions. Given that Bitcoin and digital assets are one of the most sensitive tools to liquidity, they are naturally affected by volatility and risky asset drawdowns.
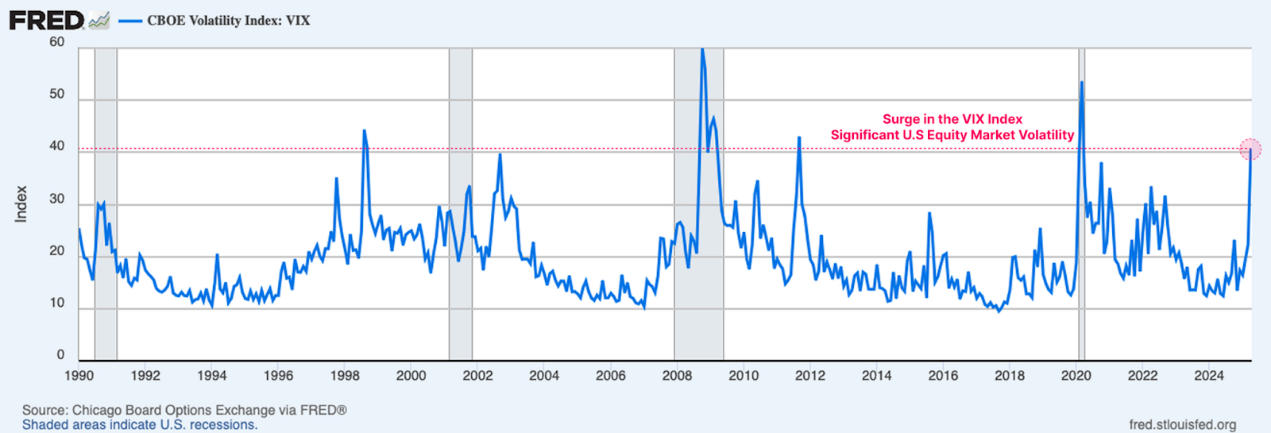
Source: FRED
The performance of “hard” assets remains impressive in this turmoil. As investors flock to a traditional safe-haven asset, gold prices continued to soar, hitting a new high of $3,300. Bitcoin was initially sold to $75,000 along with risky assets, but has since recovered some of its declines and trading prices have rebounded to $85,000.
As the world gradually adapts to changing trade relations, gold and Bitcoin are increasingly becoming the market focus as global neutral reserve assets. It can be argued that gold and Bitcoin’s performance last week sent a compelling signal.
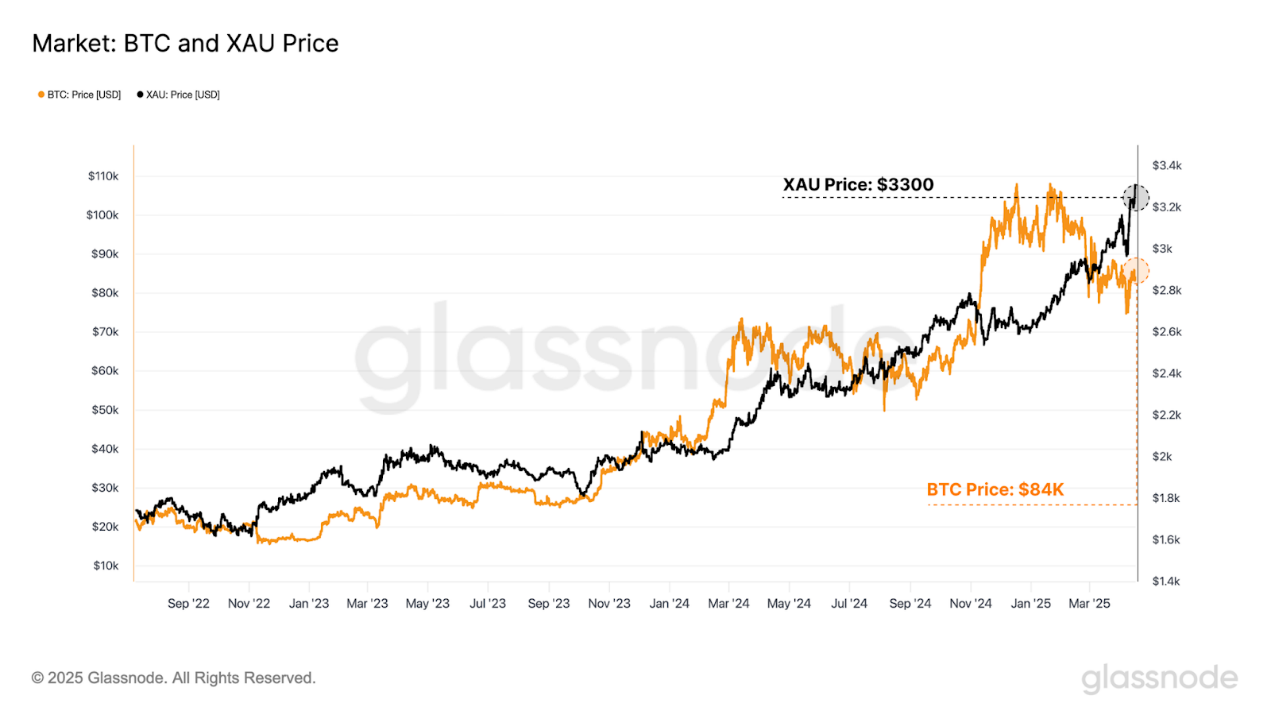
Source: [Glassnode](https://studio.glassnode.com/charts/4a3e114f-c25a-4019-562a-627bca31df16?s=1279324800&u=1744814399&zoom=)
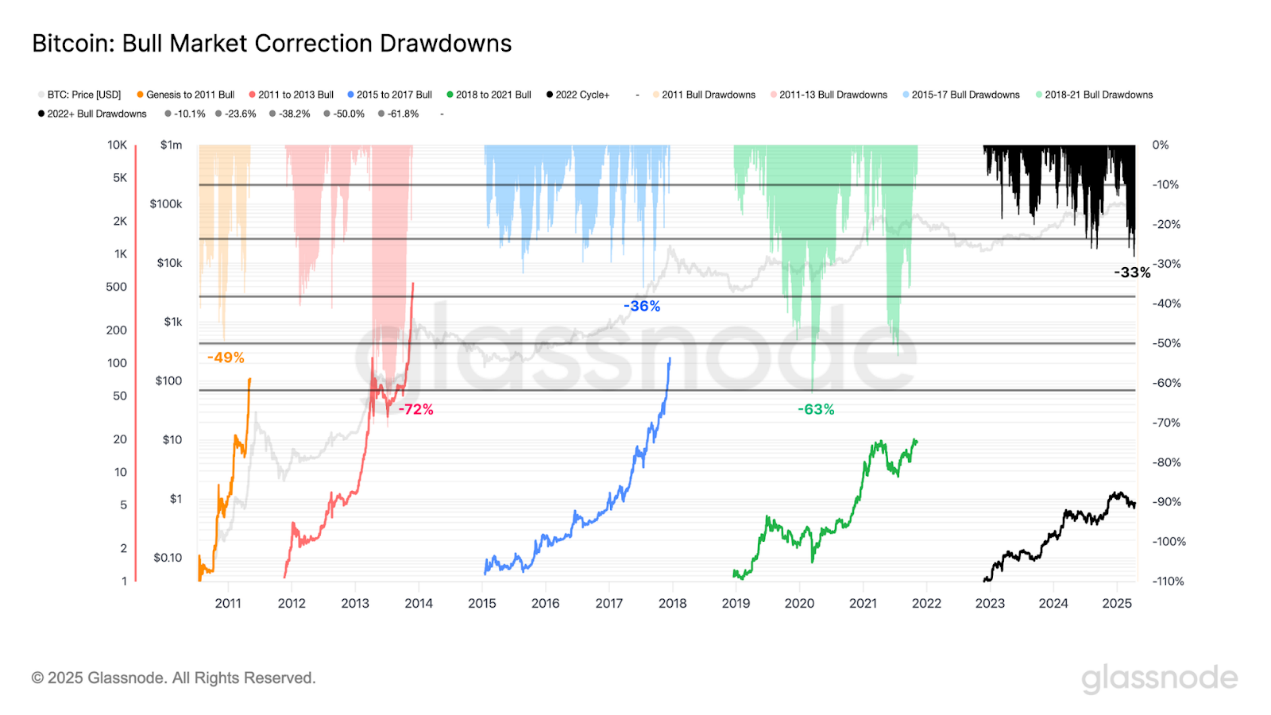
Bitcoin remains resilient
Although Bitcoin is still trading within the $85,000 region, Bitcoin’s volatility and retracement have been intensifying in recent months. The asset hit its biggest drop since the 2023-25 cycle, down 33% from its historical high.
However, the magnitude of this retracement is still within the scope of previous bull market corrections. In macroeconomic events like last week, Bitcoin usually experiences a decline of more than 50%, highlighting the still quite steady sentiment of modern investors towards Bitcoin in adverse circumstances.
Source: [Glassnode](https://studio.glassnode.com/charts/bf532ce2-a66b-4798-6deb-bf3ba7decc59?s=0&u=1744814396)
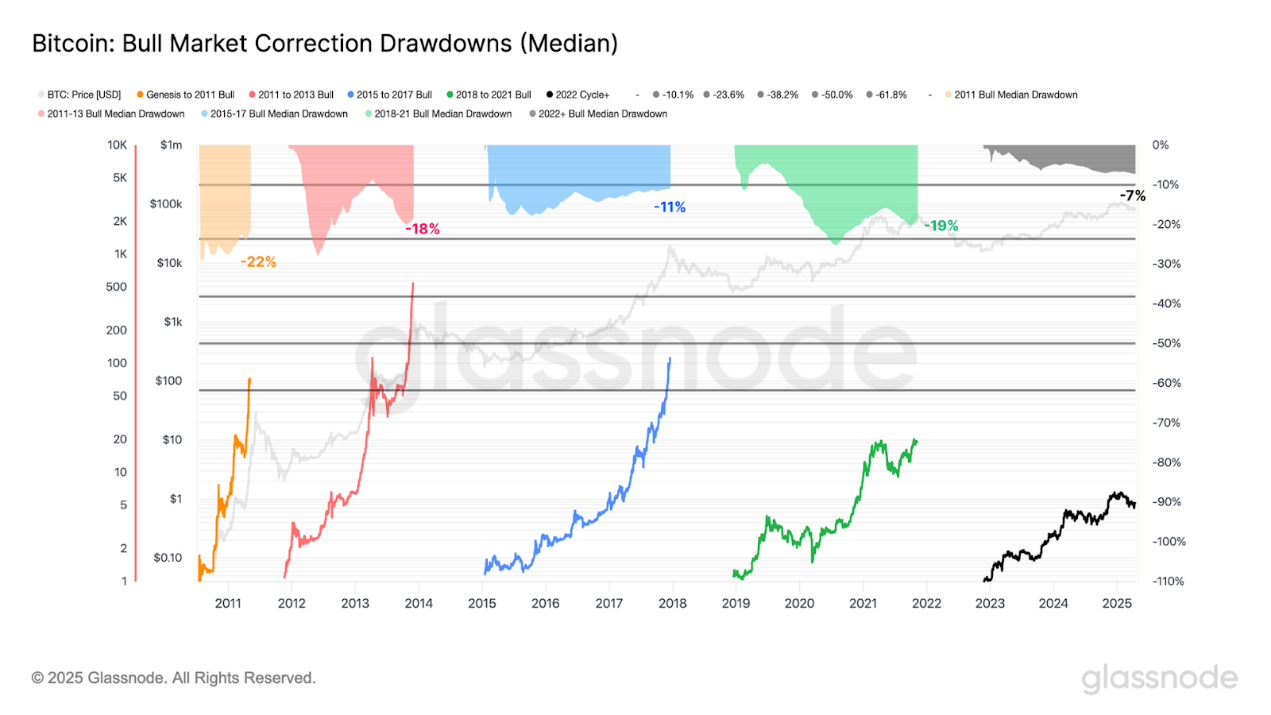
In order to quantify the resilience of the current cycle, the median retracement of previous bull markets can be evaluated.
- 2011: -22%
- 2011-2013: -18%
- 2015-2018: -11%
- 2018-2021: -19%
- 2022 and beyond: -7%
The median retracement of the current cycle is smaller than in all previous cases. The drawdown has been smaller and more controllable in nature since 2023, indicating a more resilient demand situation and that many investors are more willing to continue holding during market turmoil.
Source: [Glassnode](https://studio.glassnode.com/charts/b7046375-1041-482f-5d13-28f8a9d8caf6?s=0&u=1744814407)
Liquidity continues to shrink
In addition, it can also be evaluated how macro uncertainty affects Bitcoin’s liquidity status.
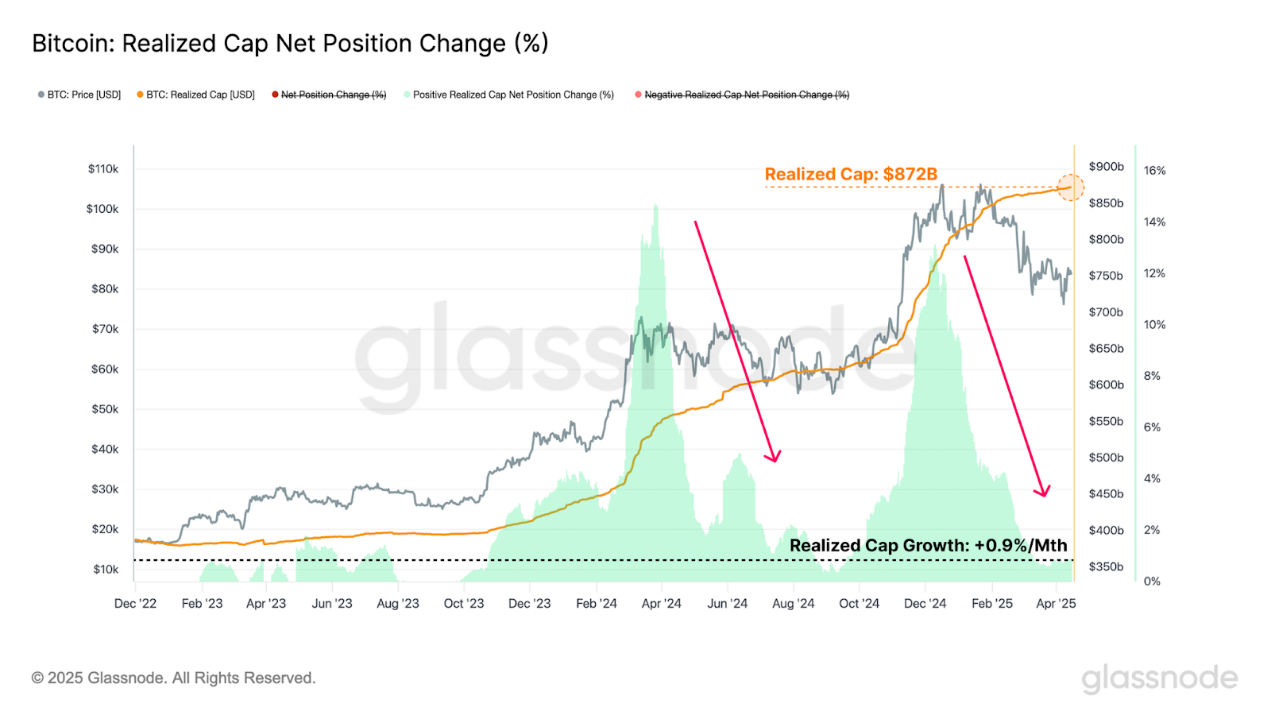
One way to measure internal liquidity of Bitcoin is to implement a market capitalization indicator that calculates the cumulative net inflows into digital assets. The market value has reached its all-time high of US$872 billion, however, the capital growth rate has contracted to just +0.9% per month.
In the context of a challenging market, capital flowing into the asset continues to grow positively. Given that new capital inflows into the asset is slowing, indicating that investors are less willing to allocate capital in the short term, hedging may remain the mainstream sentiment at the moment.
Source: [Glassnode](https://studio.glassnode.com/charts/ba1ec93d-85f4-41fe-5606-798a2f30013a)
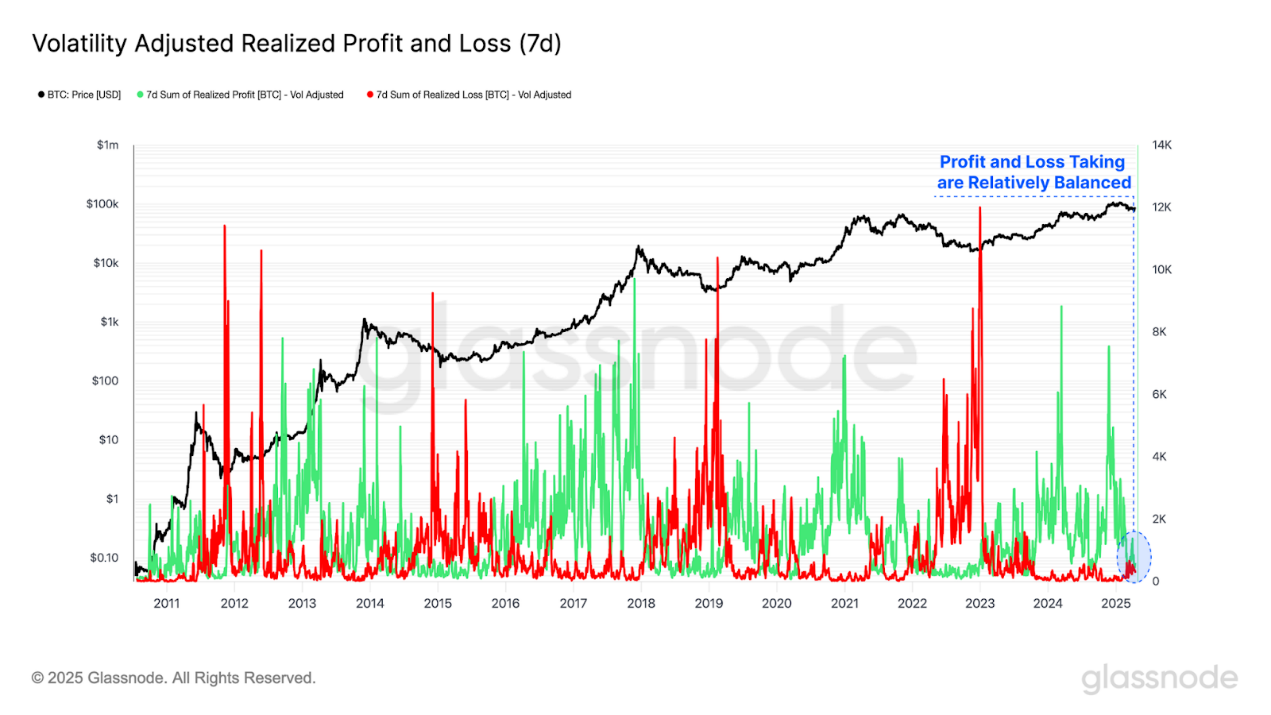
The realized profit and loss indicator, as the composition of the realized market value, can measure the difference between the token's buying price and its selling price on the chain.
- Tokens that spend more than their buying price are considered locked in realized profits
- Tokens below their buying price are considered locked to have been lost
The achieved profit and loss is measured in bitcoin and can standardize all profit and loss events. In addition, it has been further refined by adjusting volatility (7 days achieved volatility) which helps explain the diminishing returns and growth rates of Bitcoin over its 16-year history.
Currently, profit and loss activities are relatively balanced, and capital inflows are relatively neutral, reflecting the saturation of investor activities within the current price range.
Source: [Glassnode](https://studio.glassnode.com/charts/7e9ea659-01f3-4bf3-5ec1-33777df5ea97)
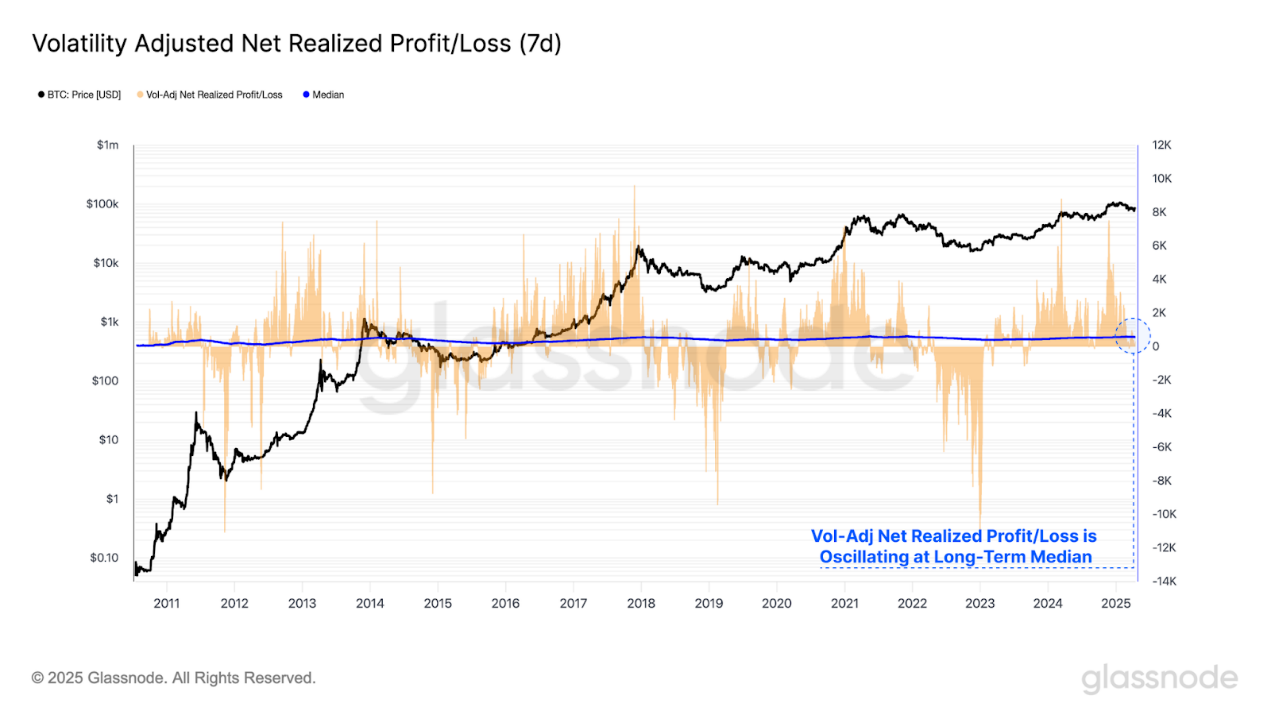
By calculating the difference between realized profit and loss, the realized net profit and loss indicator can be obtained. This metric measures the dominant direction of value inflow/outflow networks.
Using the volatility-adjusted net realization profit and loss indicator, it can be compared with the cumulative median to distinguish the two market models.
- Continuously above the median price usually indicates a bull market and net capital inflows.
- Continuously below the cumulative median is usually seen as a bear market, and Bitcoin experiences net capital outflows.
The market usually pushes investors to the brink of greatest pain, often peaking at the turning point of the bull and bear cycle. It can be seen how the net realized profit and loss adjusted by volatility is circulating around its long-term median and acts as a means regression tool.
This indicator has now returned to the neutral median, indicating that the Bitcoin market is now at a critical decision point and sets the boundaries for bulls to reestablish support levels in the current price range.
Source: [Glassnode](https://studio.glassnode.com/charts/22ef95fa-bed1-4a18-5e56-a74093870d1a)
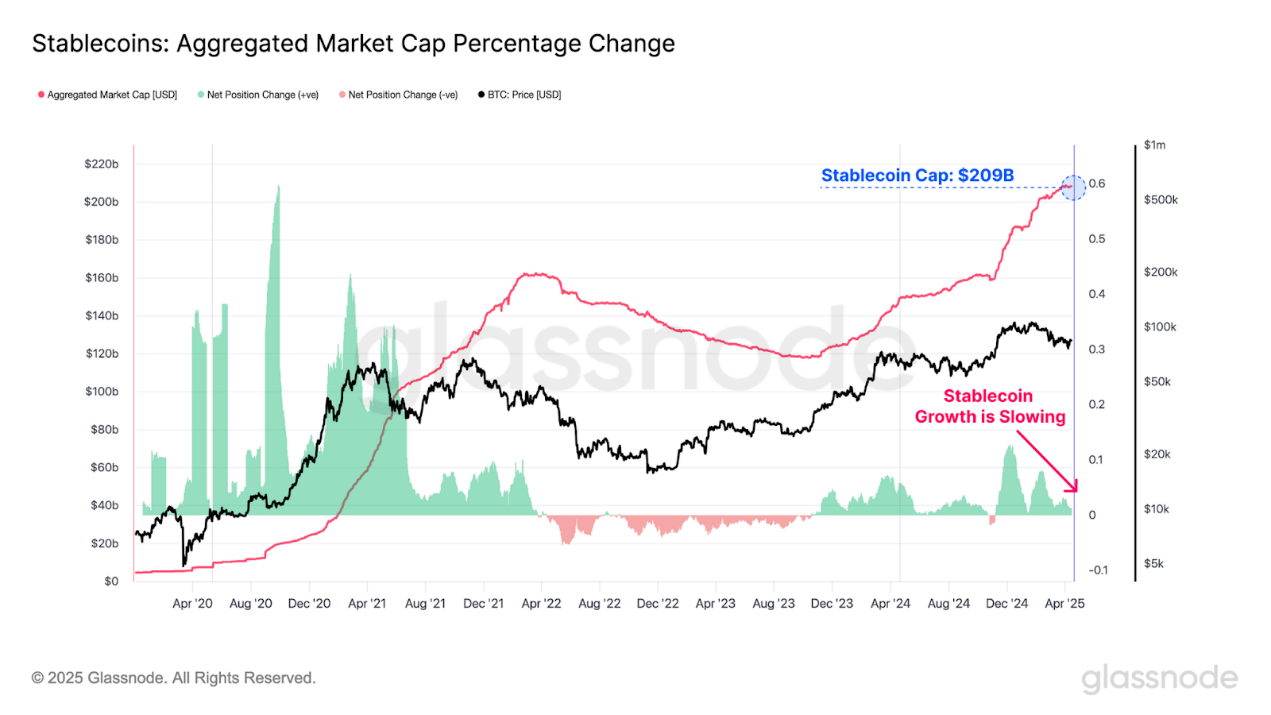
Stablecoins have become the underlying asset category in the digital asset ecosystem, acting as quotation assets in DEX and CEX. Evaluating liquidity through the perspective of stablecoins provides new dimensions for analysis and helps to have a more comprehensive understanding of the liquidity status of digital assets.
The supply of stablecoins has maintained positive growth, but has slowed in recent weeks. This further demonstrates that the broader liquidity of digital assets is shrinking, manifested in the weakening demand for digital dollars.
Source: [Glassnode](https://studio.glassnode.com/charts/66084ad0-696f-4932-7852-fcf55d2f8a1a)
Review investor pressure
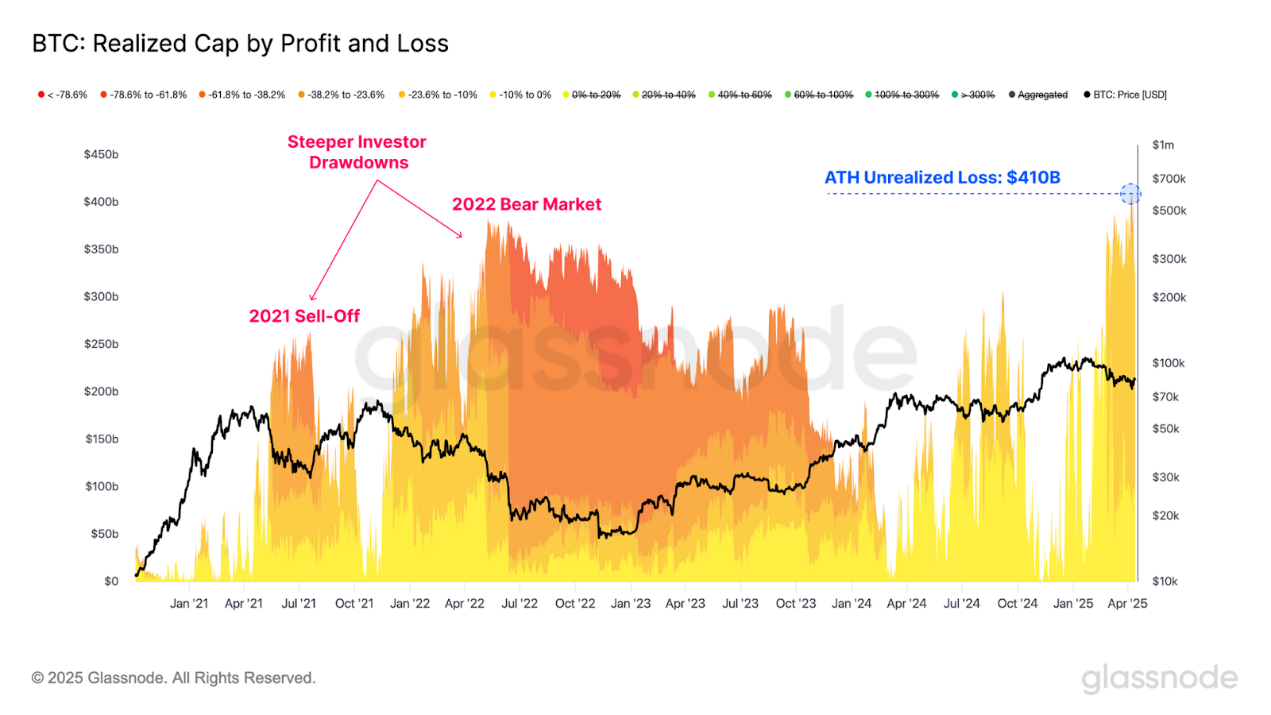
In the midst of ongoing market turmoil, it is crucial to assess the scale of unrealized losses currently held by Bitcoin investors.
It was noted when measuring the unrealized losses held by the market, that unrealized losses had reached a new high of US$410 billion during the period when the market fell to US$75,000. When looking at the composition of unrealized losses, you can see that most investors hold a pullback of up to -23.6%.
The total scale of unrealized losses is larger than that of the May 2021 sell-off and the 2022 bear market. However, for individual investors, the market experienced a more drastic retracement, up to -61.8% and -78.6% respectively.
While the total unrealized losses are greater (considering that Bitcoin is now a more valuable asset), individual investors face less challenges than previous bear markets.
Source: [Glassnode](https://studio.glassnode.com/charts/breakdowns.MarketcapRealizedUsdByPnl?a=BTC&c=usd&mScl=lin&pScl=lin&resolution=24h&s=1587048075&u=1744814475)
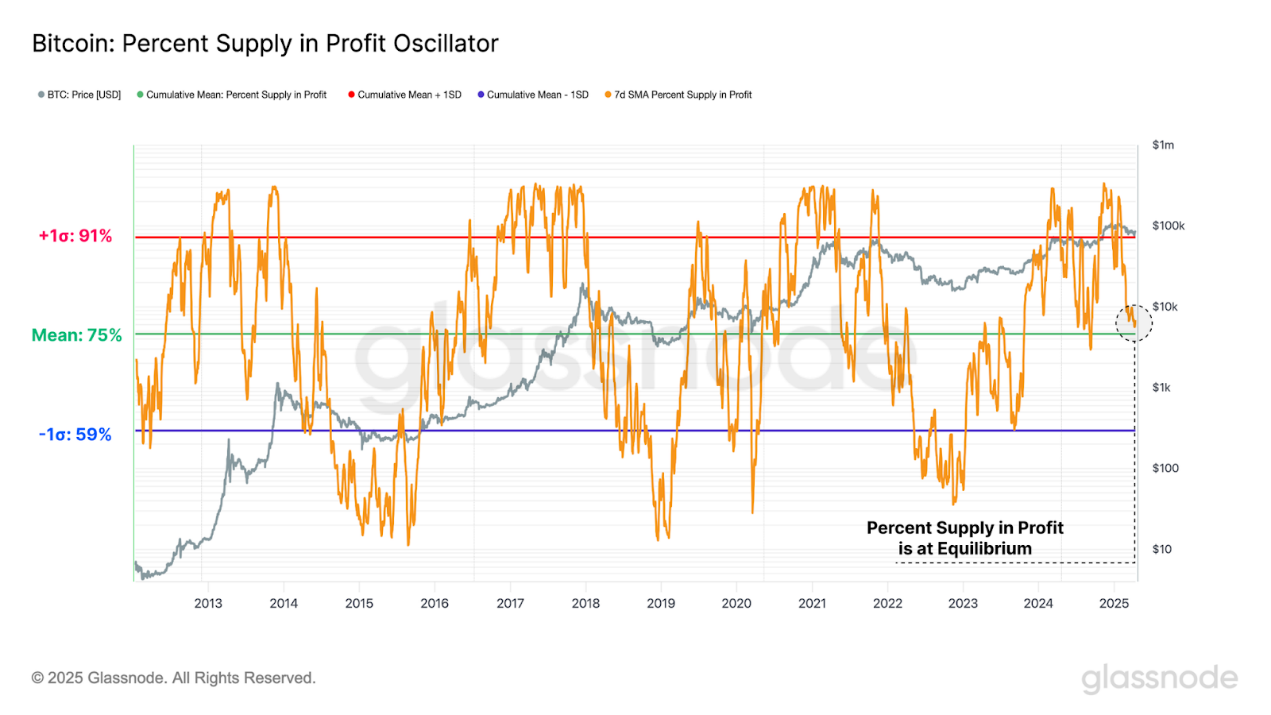
Although the loss has reached its historical highest level, the proportion of profitable positions in circulation supply is still as high as 75%. This shows that most loss-making investors only buy after the top pattern appears.
It is worth noting that the percentage of profit supply is approaching its long-term average. Historically, this is a key area that needs to be defended before the vast majority of cryptocurrencies fall into losses and a key threshold between bull and bear.
- A typical feature of a bull market is that the profit supply is higher than its long-term average and usually finds support throughout the bull market.
- Historically, periods of depth continued to fall below the long-term average were seen in bear markets, and frequent pullbacks in bear markets confirmed the decline in profitability.
Similar to the net realization profit and loss indicator, if it can be held, it will help rebound from the long-term average range.
Source: [Glassnode](https://studio.glassnode.com/charts/98beb71c-b3e6-4cfd-639c-2013da719d4d)
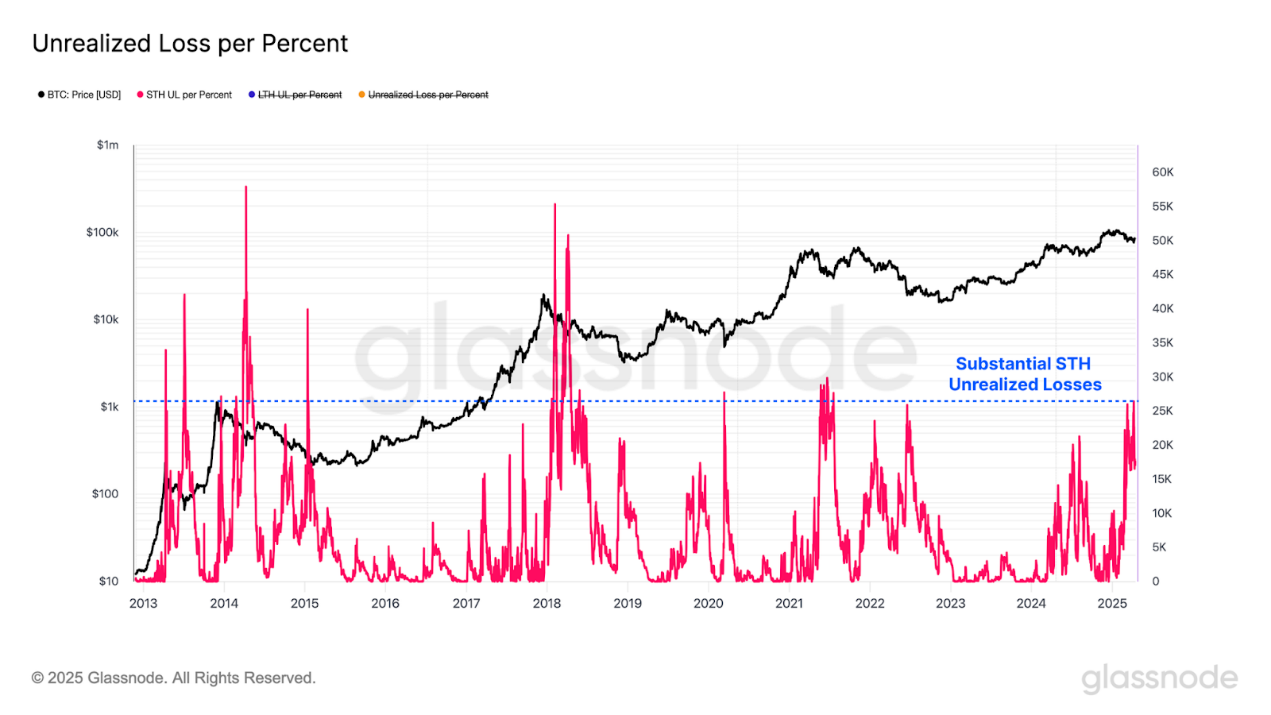
As the market continues to shrink, the absolute scale of unrealized losses is expected to grow. To explain this phenomenon and standardize pullbacks of varying magnitudes, a new indicator is introduced here: unrealized losses per percentage retracement, which represents the percentage drop in losses in Bitcoin relative to the historical high.
After applying this indicator to the short-term holder group, it was found that after the deep adjustment of the drawdown, their unrealized losses were already considerable, comparable to the level in the early stages of the bear market.
Source: [Glassnode](https://studio.glassnode.com/charts/65663e33-0606-4291-4bd5-df62d9ce6df0)
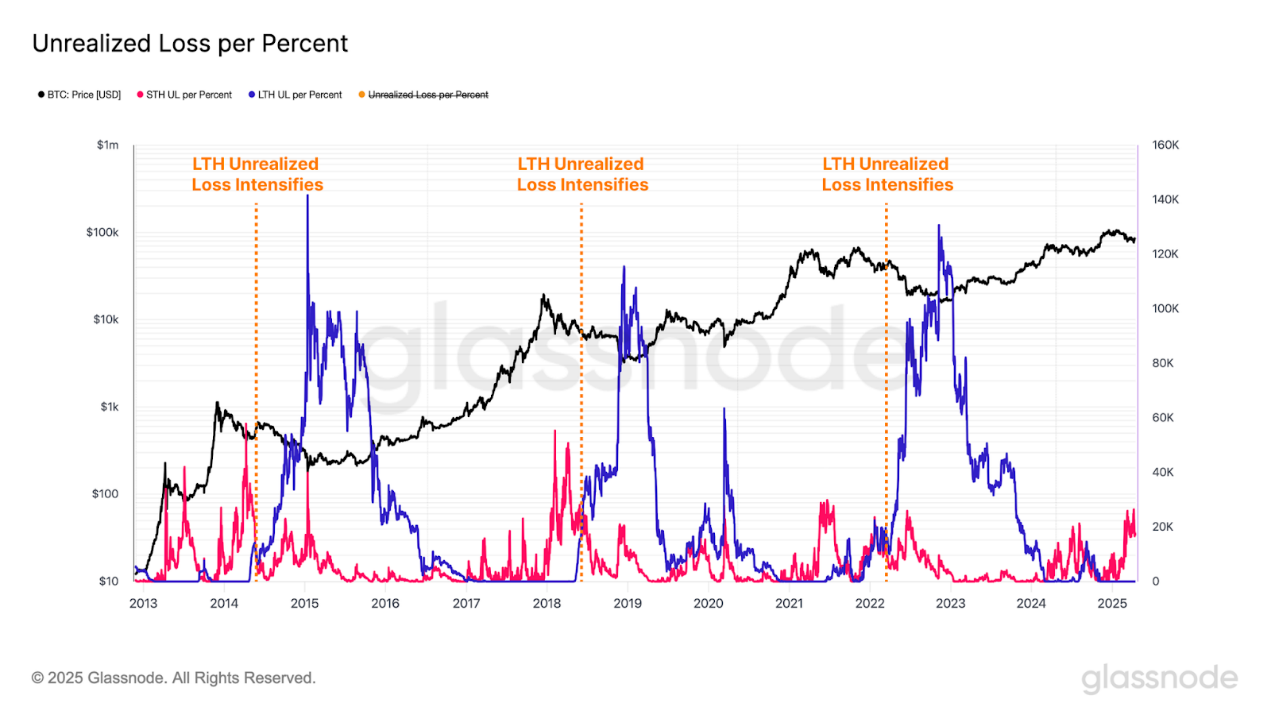
Nevertheless, the current unrealized losses are mainly concentrated on new investors, while long-term holders are still in a unilateral profitable state. However, an important nuance is emerging: the unrealized loss levels of this group may rise as recent top buyers gradually become long-term holders.
Historically, a significant expansion of unrealized losses for long-term holders often marks a bear market confirmation, although there will be some delays after the market peaks. So far, there is no clear evidence that this pattern shift is underway.
Source: [Glassnode](https://studio.glassnode.com/charts/65663e33-0606-4291-4bd5-df62d9ce6df0)
Summary and Conclusion
The macroeconomic outlook remains uncertain, and continued changes in global trade dynamics have exacerbated large fluctuations in the U.S. Treasury and stock markets. It is worth noting that Bitcoin and gold have performed particularly strongly during this challenging time. This may be an exciting signal that the foundations of the financial system are entering a period of transformation and change.
Despite its significant resilience, Bitcoin has not been spared from the impact of intensified global market volatility, setting the largest drop since the 2023-2025 cycle. This greatly affects new market participants, who now bear the majority of the market losses. However, from the perspective of individual investors, the market experienced more severe declines in previous cycles, especially during the bear markets in May 2021 and 2022. In addition, mature and long-term investors are still not affected by ongoing economic pressure and are almost in a state of unilateral profit.
Related Readings: Fidelity: Has Bitcoin reached the peak of this cycle?

