Ethereum price falls into a "cursed" downward trend that may continue throughout the year

Reprinted from jinse
03/19/2025·2MAuthor: Yashu Gola Source: cointelegraph Translation: Shan Oppa, Golden Finance
Ethereum native token ETH has entered the oversold area many times recently, but it has not shown any signs of bottoming out. The current trading situation is similar to a similar situation in history, with the market structure suggesting that ETH may repeat this trend in the second to third quarters of 2024.
**Ethereum has repeatedly broken down, and there may still be room for
downside**
On the 3-day K-line chart, the relative strength index (RSI) of ETH is still below 30, which usually indicates a potential rebound opportunity.
However, historical data show that after ETH entered the oversold area, it failed to form a clear bottom, but continued to fall, indicating that the market is still dominated by bears.
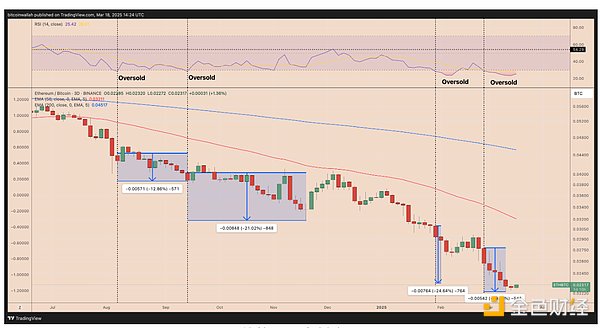
Since mid-2024, the ETH/BTC trading pairs have experienced downward trends many times, with declines reaching 13%, 21%, 25% and 19.5% respectively, showing a chain of downward trends. In addition, both the 50-day and 200-day exponential moving averages (EMA) are on a downward trend, further confirming the lack of upward action energy in the market.
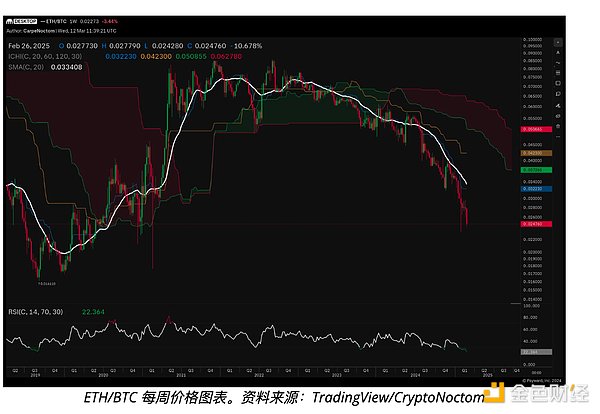
X platform market analyst @CarpeNoctom pointed out that the negative price performance of the ETH/BTC trading pair has not yet formed a bullish divergence (i.e., the price hits a new low but the RSI forms a higher low), further weakening market confidence.
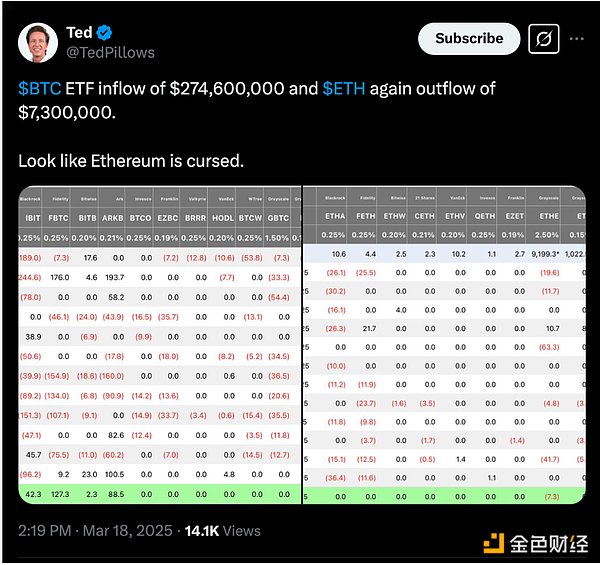
ETH ETF capital outflow and on-chain data show further weakness
The “cursed” downward trend of ETH/BTC is particularly prominent in the entire crypto market, especially in the outflow of US spot ETH ETFs and negative on-chain data .
In March 2024, net inflows of spot Ethereum ETFs fell by 9.8% , to US$2.54 billion . In contrast, net inflows of spot Bitcoin ETFs fell by only 2.35% , still at $35.74 billion .
Meanwhile, the average daily Gas fee (in median) of the Ethereum main network has dropped to 1.12 GWEI , a decrease of nearly 50 times compared to the same period in 2023 .
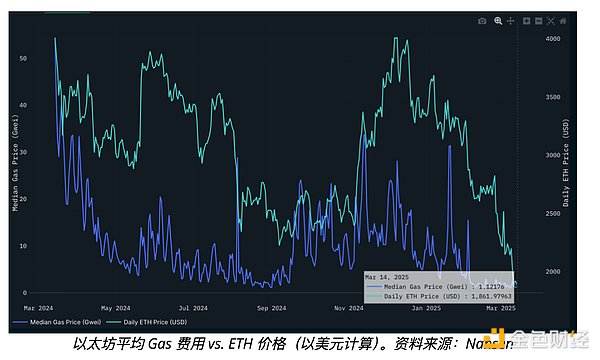
"Although ETH ushered in a second round of gains at the end of 2024, mainnet activity (measured by Gas consumption) has not been restored," data analytics platform Nansen said in its latest report.
Nansen believes that the decline in main network transaction activity is mainly affected by the transfer of funds and users to Solana and Layer 2 networks (L2s) , and said that ETH 's risk/return ratio is inferior to BTC and some altcoins in the low-valuation segment, so it maintains a cautious bearish position .
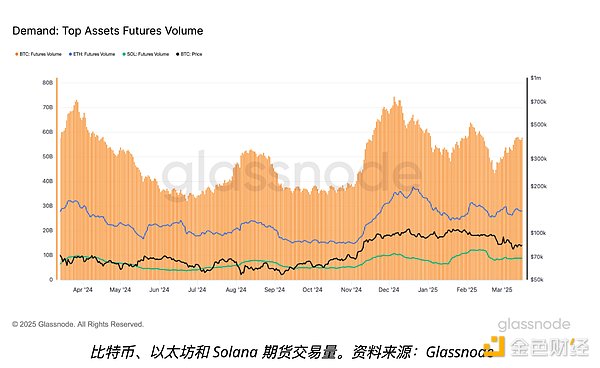
In addition, the weak demand for ETH compared to BTC is also reflected in futures trading volume : Bitcoin futures trading volume rebounded 32% from its low on February 23, reaching US$57 billion as of March 18. Ethereum trading volume has basically stagnated and no significant growth has been seen (data source: Glassnode).
ETH/BTC may fall by 15%
The ETH/BTC trading pair is forming a bear flag pattern on the daily chart, which usually occurs in the consolidation stage after a sharp decline, showing a converging trend line .
From a technical point of view, once the bear flag pattern falls below the lower track support line , the price will usually fall at a height comparable to the previous decline . According to this rule, the downward target price of ETH/BTC in April was 0.01968 BTC , down 15% from the current level.
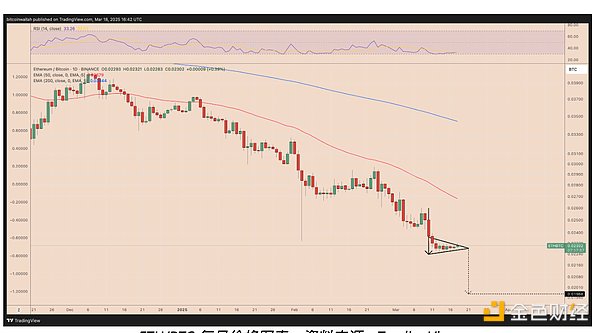
In addition, the ETH/BTC pairs are well below the 50-day and 200-day index moving averages (EMA), and these two key moving averages are still on a steep downward trend , indicating that the market is still in a sustained bear market structure .
Although the downside risk still exists, if ETH/BTC breaks through the upper resistance of the bear flag pattern and successfully converts the 50-day EMA into support , it may invalidate the current bearish trend and the market is expected to rebound.