Bitcoin Magazine: Decode the Relevance of Bitcoin and Stock Markets

Reprinted from panewslab
03/15/2025·3MSource: Bitcoin Magazine Pro Team
Compiled by: BitpushNews
When investing in Bitcoin, it is often difficult for you to understand the drastic price fluctuations in the market. To understand these drastic volatility, you compare Bitcoin’s performance to traditional assets such as stocks. This helps you see the big picture, and you quickly discover that while Bitcoin and stock markets often fluctuate in sync, their charts tell different stories. The comparison chart of Bitcoin vs. stock markets is still a key component of your Bitcoin investment strategy. In this guide, you will learn how to analyze and interpret the chart to make more informative and strategic investment decisions.
Is there any correlation between Bitcoin price and stock market?
When financial markets fluctuate synchronously, they are considered to be relevant. For example, if the price of one asset rises or falls and the other asset fluctuates in the same direction, they are positively correlated; if the two fluctuate in reverse, they are negatively correlated; if the price fluctuates are not related, they are independent.
Correlation is measured as values from -1 to +1:
- +1 means that the asset fluctuates completely synchronously
- -1 means complete reverse fluctuation
- 0 means that price fluctuations are independent of each other
As far as Bitcoin is concerned, correlation shows how its price volatility is associated with other markets such as the stock market. As an emerging digital asset, the correlation between Bitcoin and stock prices has changed — especially as its popularity and adoption increase.
Bitcoin vs Stock Market: Independent Asset Class
In the first few years after Bitcoin was born, it had little correlation with the S&P 500. Until 2012, Bitcoin prices remained stable, while the S&P 500 showed a conventional steady rise (with a slight decline). Bitcoin's first sharp rise from the end of 2013 to the beginning of 2014 was not accompanied by the simultaneous rise of the S&P 500.
The decline in the stock market at the end of 2016 occurred simultaneously with the rise in Bitcoin prices. Bitcoin price fluctuates violently, while the S&P 500 index changes relatively smoothly. Until 2018, Bitcoin and the S&P 500 price peaks and troughs remained almost unsimilar.
Bitcoin and Stock Market Relevance from the End of 2021 to 2023
From the end of 2021 to 2022 to 2023, the price of Bitcoin rises and falls similar to stock prices (although more volatile). The figure below shows the comparison between Bitcoin (BTC) prices and S&P 500 (SPX) and Nasdaq Comprehensive Index (ICIX) from November 2022 to November 2023.
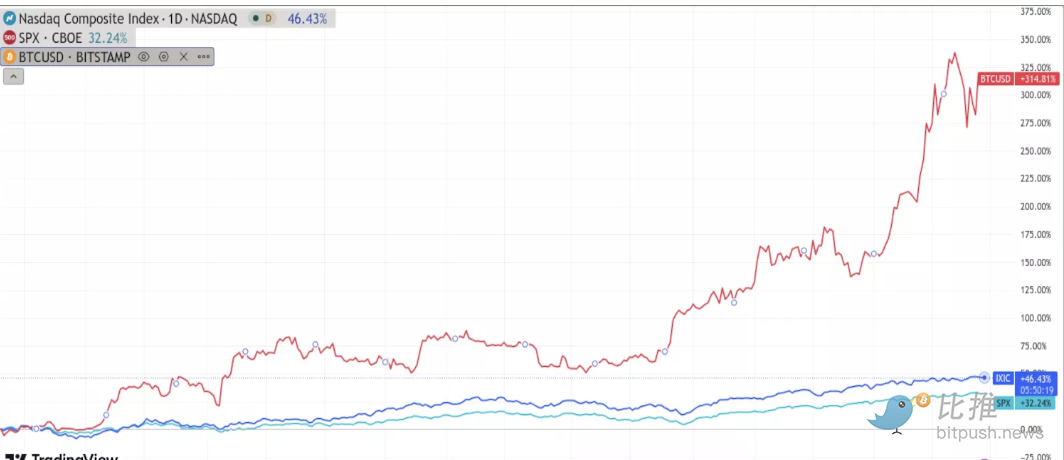
The S&P 500 measures the performance of large-cap stocks, and the Nasdaq Composite tracks the Nasdaq 2500 stocks with market value weighting. It can be seen that there is some synchronization between the two trends, but Bitcoin shows stronger volatility - especially after major events, which shows that traders and investors are beginning to look at Bitcoin as they treat stocks.
What does this mean for investors?
The correlation between Bitcoin prices and stocks may be a coincidence, and may also indicate that its price follows the stock market trend. What does this mean for investors?
As investors appear to regard Bitcoin as stocks, digital assets may react to market influence factors just like stocks. For example:
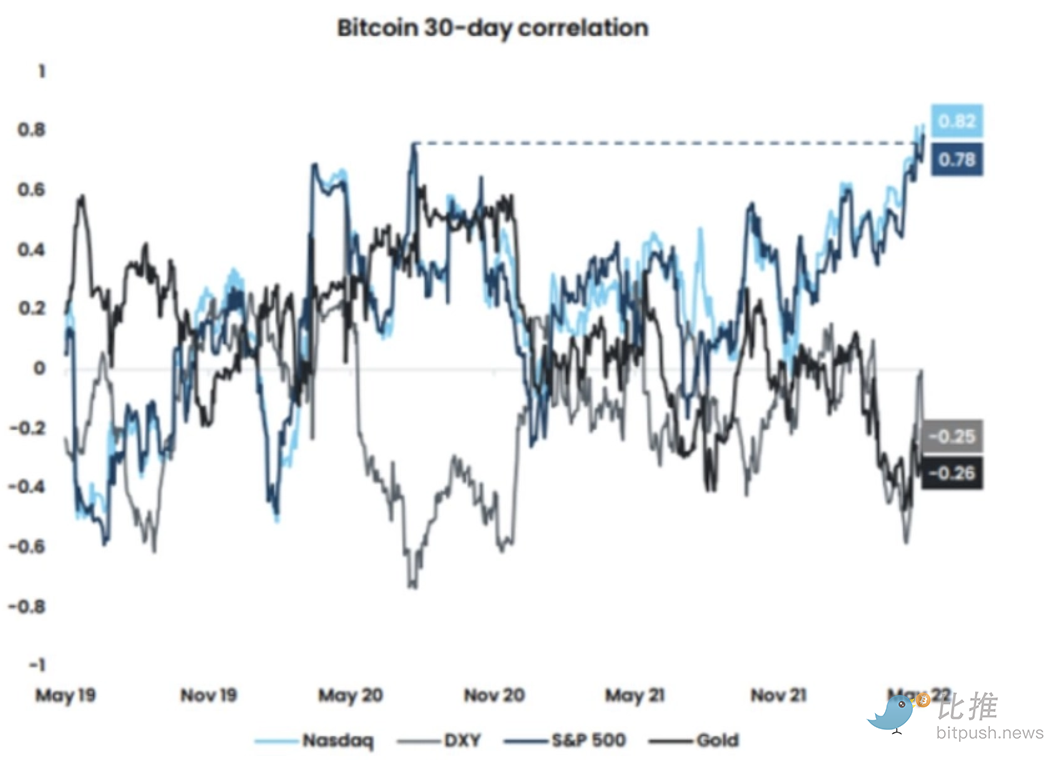
- May 4, 2022: The Federal Reserve announced the hike of federal funds target interest rate range to 0.75%-1%
- May 5, 2022: Bitcoin fell to about $31,000, the Nasdaq 100 index (NDX) fell about 1,400 points, and the S&P 500 fell about 150 points
Bitcoin price fluctuates more significantly, but the market response is essentially the same. Overall, investors may temporarily deal with Bitcoin in the way they treat stocks. BTC is still in the price discovery phase and the market is determining the role it will play.
Interpretation of Bitcoin and Stock Market Charts

Investors who want to profit from Bitcoin price fluctuations first need to understand how to read the price chart. The price chart visually displays the historical price performance of assets over time. If you look closely at the prices of Bitcoin and Nasdaq Composite Indexes in the past four years, you can find that the correlation between the two is more obvious.
Based on Bitcoin and stock market charts, the following are the key correlation cases:
- December 2018: Bitcoin and Nasdaq both fell to historical lows ($3,689 vs 6,192 points)
- June 2019: Both experience sudden and sharp price peaks
- February 2020: Fast drop after quarterly highs
- March 2021: Prices soar to unusually high
- October 2021: After maintaining a high for several months, it fell simultaneously, and did not recover this year
- November 2021: Correlations are significantly enhanced, Bitcoin almost entirely follows Nasdaq fluctuations
- May 2022: After a sharp decline in synchronous decline, Bitcoin begins to mirror the tiny volatility of Nasdaq
Analysis on the causes of the correlation between Bitcoin and the stock
market
The correlation between Bitcoin and the stock market is not driven by a single factor. According to the comparison chart analysis of Bitcoin and the stock market, multiple factors jointly contribute to the similarity between the two. Similar to the stock market, Bitcoin prices are deeply influenced by supply and demand relationships and investor sentiment:
- Rising drivers: When market demand is strong, market prospects are optimistic, and supply is limited, prices of both often rise simultaneously
- Reasons for falling: When investors are worried about future economic trends or encounter adverse policies, prices usually fall collectively
This linkage model of one rises and another declines makes the pace of Bitcoin and the stock market consistent. It is worth noting, however, that certain factors may weaken this correlation.
Bitcoin and Stock Market Relevance: Evolving Investment Trends
Bitcoin is not subject to the same regulatory policies and government regulations as the stock market. For example, in 2021, the Chinese government's complete ban on Bitcoin mining affected the price of Bitcoin, but it had no impact on the stock market. Technical differences also exist - the stock market is not affected by data storage problems and power shortages, which directly affect Bitcoin miners.
Why are the charts still showing high correlation in the recent past?
The answer lies in the increased interconnection between Bitcoin and stocks. Despite not relying on stock market operations, Bitcoin is no longer considered a standalone asset. Its popularity makes it highly similar to traditional stock holdings.
The correlation between Bitcoin and the stock market continues to
increase
BTC is no longer a niche asset for a few enthusiasts to trade. Traditional brokerage firms and investment institutions are now involved. The same group of investors often invest in both Bitcoin and stocks, and the portfolio may include both assets.
The spillover effect of Bitcoin earnings is often reinvested in the stock market and vice versa. As the correlation between Bitcoin and the stock market continues to increase, investors gradually realize the similarity between the two and make more decisions based on the assumption that "Bitcoin is equivalent to stocks". This close correlation leads to the imitation of the volatility patterns of the two markets.
Pros and cons of high correlation
What does the correlation between Bitcoin and the S&P 500 mean for the average investor? There are pros and cons of the correlation between Bitcoin and the stock market. If Bitcoin is highly correlated with the stock market, Bitcoin investment will become more predictable.
When Bitcoin is similar to the stock market chart, it is easier to notice market trends and make informed choices. Furthermore, since stock values will always rise in the long run, the correlation between Bitcoin and the stock market may mean that BTC investors will have greater long-term returns.
Potential Benefits of Bitcoin’s Decoupling from Stock Markets
Despite some benefits, you don’t necessarily need to worry about Bitcoin’s decoupling from the stock market, which may be good news for investors who want to diversify their portfolio.
The two types of asset portfolios that are not synchronously declined can better withstand financial storms. If decoupling occurs, investors will have more opportunities to hedge the risk of a collapse.
Bitcoin - Stock Market Relevance: Impact on Investment Strategy
Whether Bitcoin is a "good thing" to decouple from the stock market depends on your investment strategy. The high correlation between Bitcoin and the stock market is beneficial for those who use stock market forecasts to develop Bitcoin trading strategies.
Investors whose portfolios are not yet fully diversified may find that the correlation between Bitcoin and the stock market makes them more vulnerable to market downside.
Will Bitcoin follow the stock market?
In investment, you need to avoid equating correlation with causality. Chart similarity does not necessarily mean that there is a direct impact between the market. . Bitcoin looks so similar to the stock market charts doesn't necessarily mean that one market will greatly affect another. In some cases, the correlation between Bitcoin and the stock market seems to be a coincidence. For example, the decline in stock markets in March 2019 was due to an increase in aluminum tariffs, while the decline in Bitcoin in March 2019 was due to the international blow to Bitcoin.
However, there is also a lot of evidence that the stock market may directly affect Bitcoin. Experts note that Bitcoin prices tend to fall when the stock market opens, regardless of other factors that affect the price. Investor confidence has severely affected the price of Bitcoin, so the recent Bitcoin crashes often occur after the stock market crash. Bitcoin traders who start hearing news of stock market downturns often trigger their conservative operations.
Will Bitcoin be decoupled from the stock market?
If your investment strategy relies on Bitcoin’s follow-up to the stock market, you need to pay attention to signs of decoupling. Experts predict that this will not happen anytime soon. As more people start to confuse Bitcoin and stock market charts, the two assets are more likely to influence each other. A slight correlation with the stock market appears to be likely to last until the rest of the year.
That being said, a certain degree of decoupling from the stock market is inevitable. The main reason is that Bitcoin tends to be more volatile. In selling, Bitcoin prices tend to plunge more than traditional stocks and then rebound sharply.
Signs and uncertainty about Bitcoin’s decoupling from the stock market
It is hard to say whether Bitcoin is decoupled from the stock market is positive or negative for Bitcoin investors. Some believe that Bitcoin may stabilize when the stock market falls; others believe that Bitcoin’s value may decline even if the stock market recovers. In any case, signs of Bitcoin’s decoupling from the stock market may include:
- Government strengthens regulation of Bitcoin
- Losing confidence in Bitcoin and decentralized finance
- Increased amount of token withdrawal
- Stock prices continue to fall
