
After three months of decline, on-chain data shows that it is about to recover?

Reprinted from panewslab
03/25/2025·1MRecently, after a period of bull market boom, the crypto asset market has begun to show signs of shrinking capital liquidity and changing investors' risk appetite. Key indicators of the on-chain data and derivatives markets both show that the market is transitioning from a high volatility and high speculation state to a more cautious and low liquidity stage. On-chain activity between Bitcoin and Ethereum shows that hot supply has dropped significantly and exchange capital inflows have decreased significantly.
Is the current market at a turning point? Is it a bullish turn or a bullish turn? How can investors seize the initiative in the shrinking liquidity and adjusting risk preferences? This article aims to analyze the current market environment based on on-chain activities of Bitcoin and Ethereum, exchange capital flows and market dynamic data.
Overall liquidity tightening and market activity decline
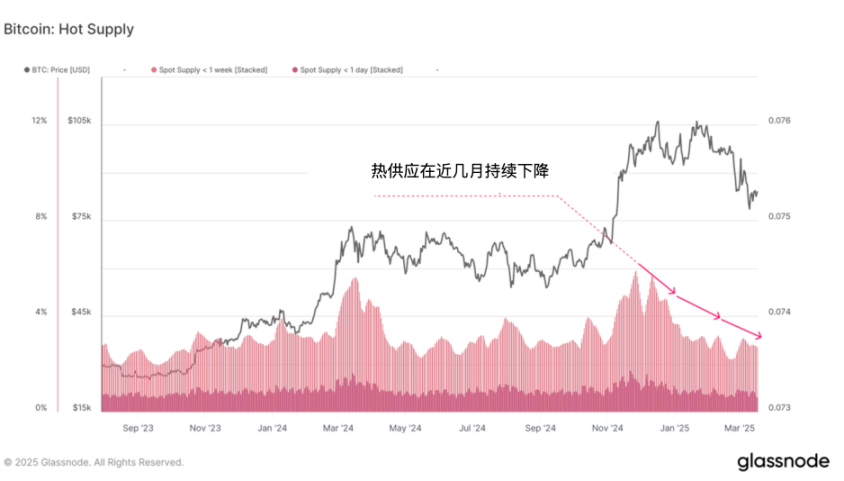
According to Glassnode, Bitcoin’s on-chain activity has dropped to a level that has not been seen for several months, with a significant decrease in transactions, which often indicates that the market has undergone a revision period after high volatility. Bitcoin’s “Hot Supply” is an indicator of measuring and quantifying active capital in the market, namely the capacity of Bitcoin that has been held for less than a week. This indicator has dropped from 5.9% to 2.8% in the past three months, showing a decline of more than 50%. This further proves the phenomenon of liquidity contraction.
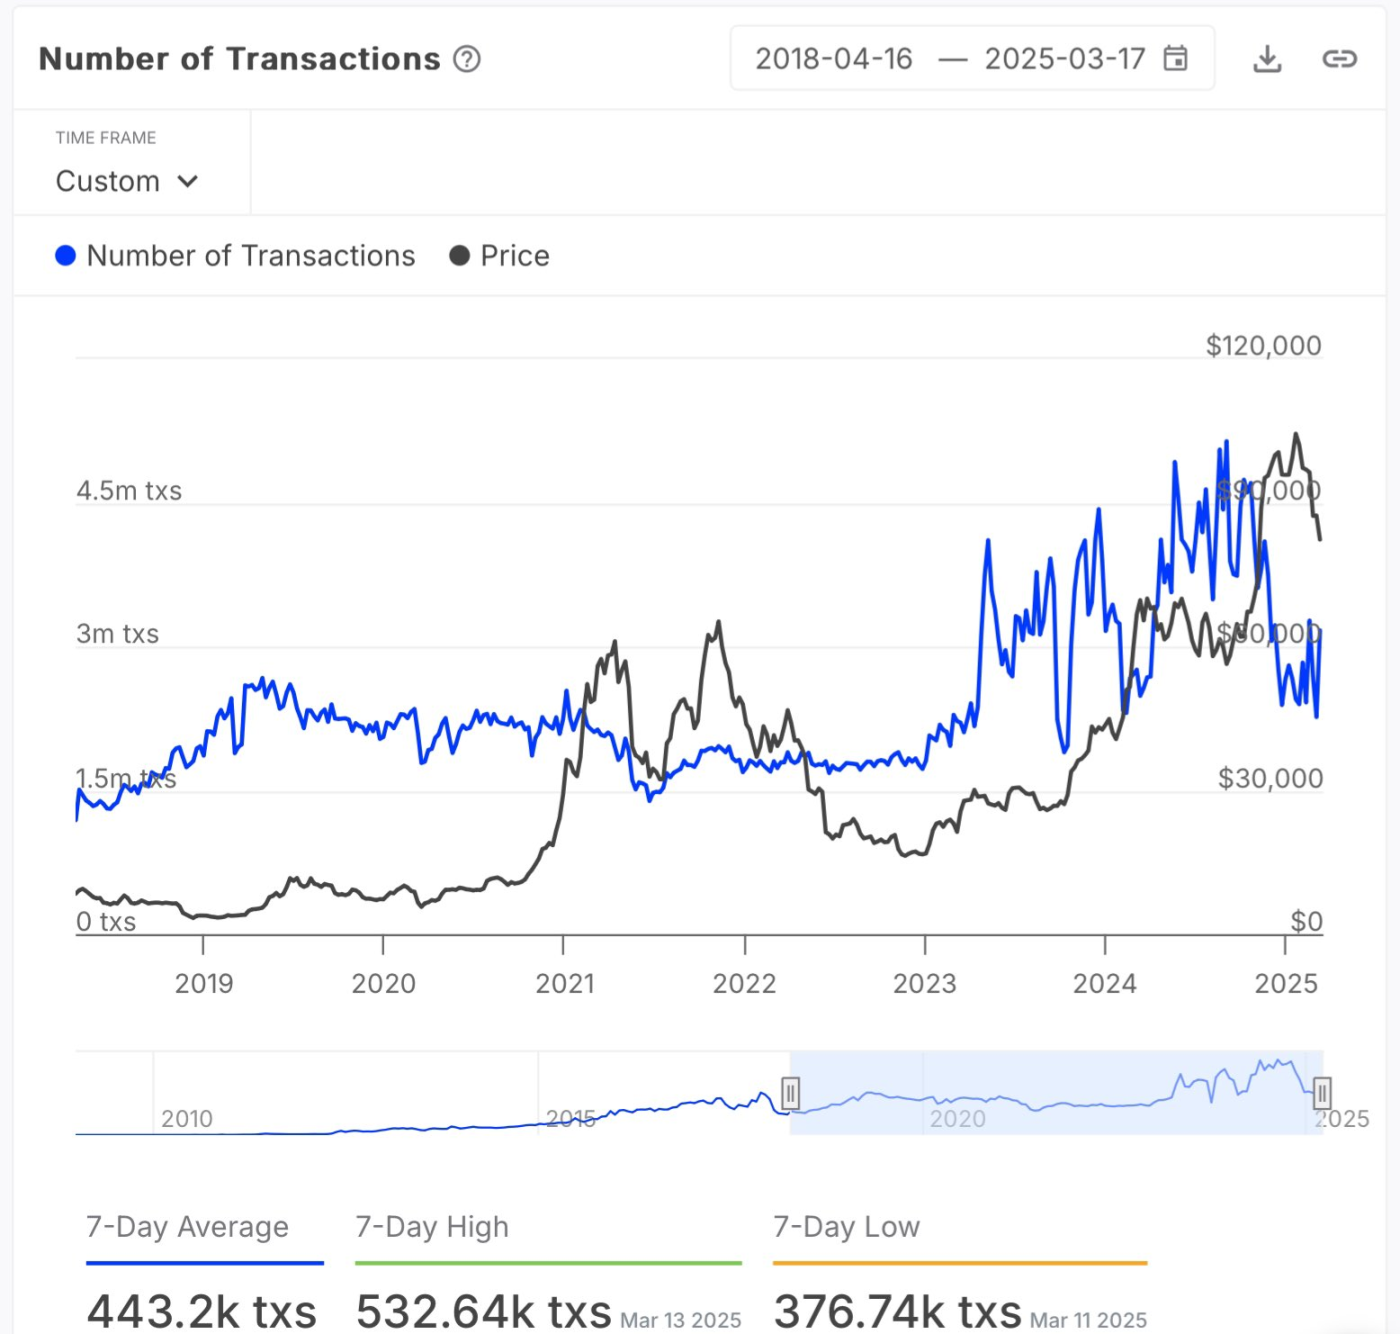
Judging from the number of on-chain transactions alone, Bitcoin’s on-chain activity has also dropped to a level that has not been seen in months, indicating that the market has entered a cooling period or a short-term interest has declined. The decrease in the number of transactions also seems to mean a decrease in speculation. If long-term holders do not sell and new capital inflows are limited, the market may enter the accumulation stage.
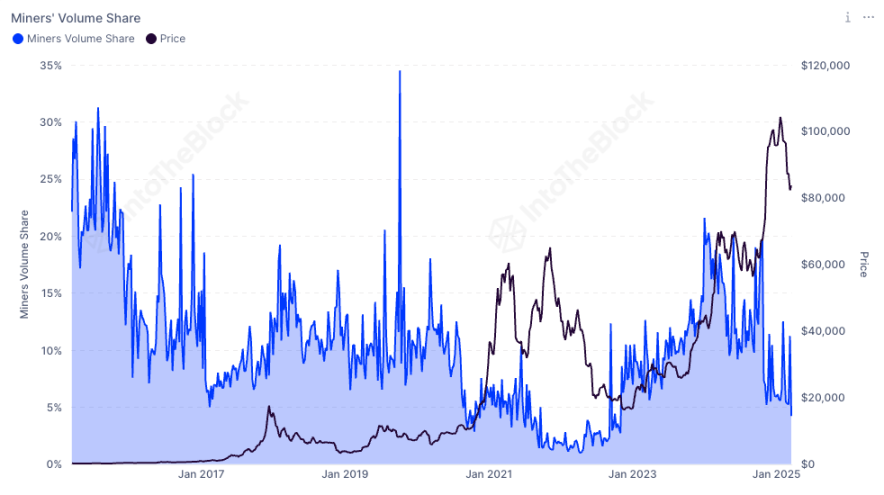
Meanwhile, Bitcoin miners' share of total on-chain transaction volume fell to 4.23%, the lowest level since November 2022. This data reflects a significant decline in miners' participation in on-chain trading activities. A lower trading share may indicate that miners are reducing their currency selling behavior and choosing to hold coins more to cope with market volatility, thereby reducing the selling pressure caused by miners' selling.
The relative decline in miner trading volume may also mean that other participants in the market (such as long-term holders or institutional investors) are more active, and the overall on-chain trading structure has changed. Against the backdrop of changes in market conditions and decline in mining returns, miners may adjust their strategies, reduce frequent on-chain transactions, and concentrate resources to optimize the income structure.
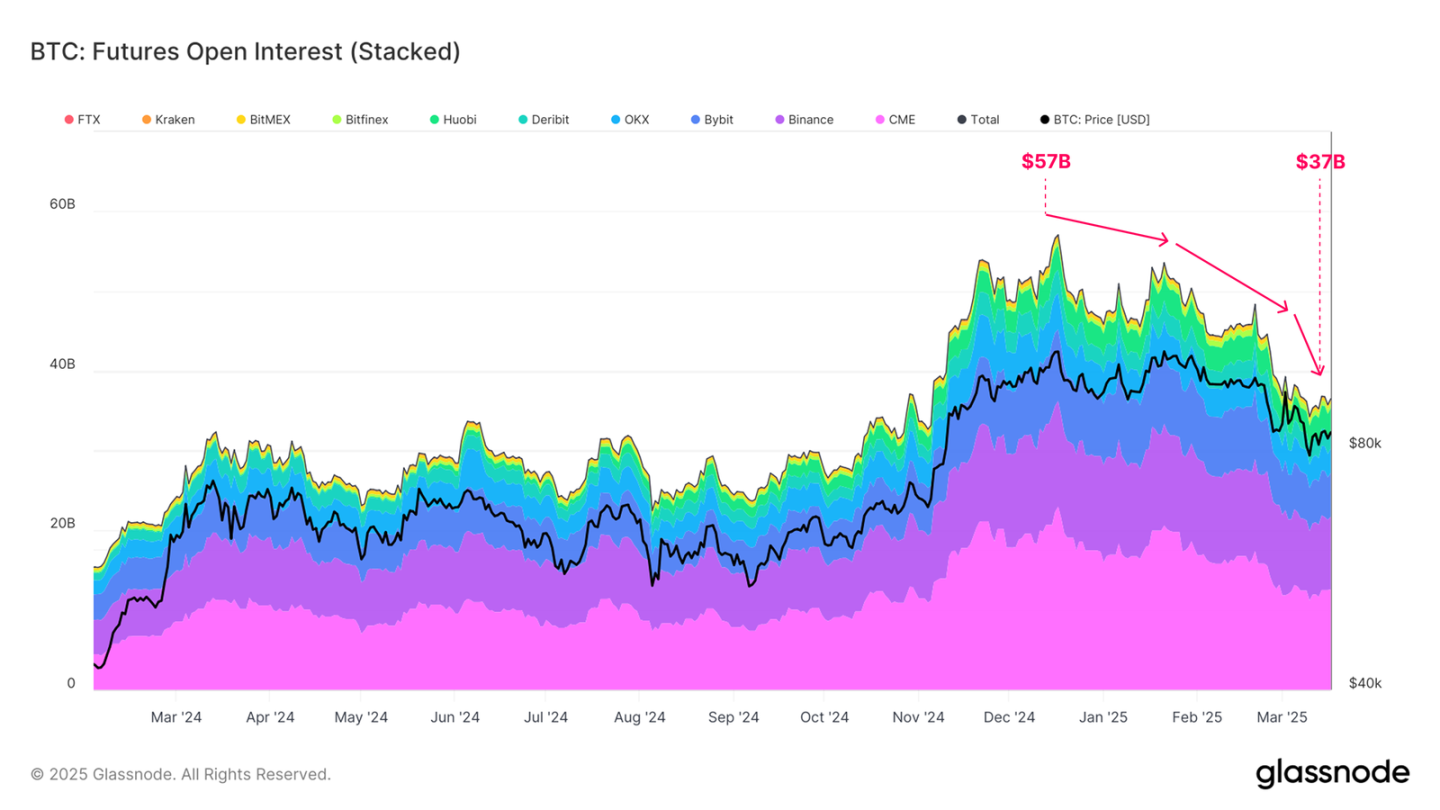
In the futures market, the total open contracts fell from USD 57 B at ATH to USD 37 B, a drop of about 35%, indicating a significant decrease in hedging and speculative activity in the market.
At the same time, after the launch of the US spot ETF in 2024, institutions have obtained arbitrage returns in the upward market through cash arbitrage (long ETF + short futures). However, as market confidence weakens and long-side arbitrage releases, arbitrage trading gradually withdraws, causing capital outflows from ETFs, further putting downward pressure on the spot market.
Ethereum exchange supply drops to lowest in nearly 10 years
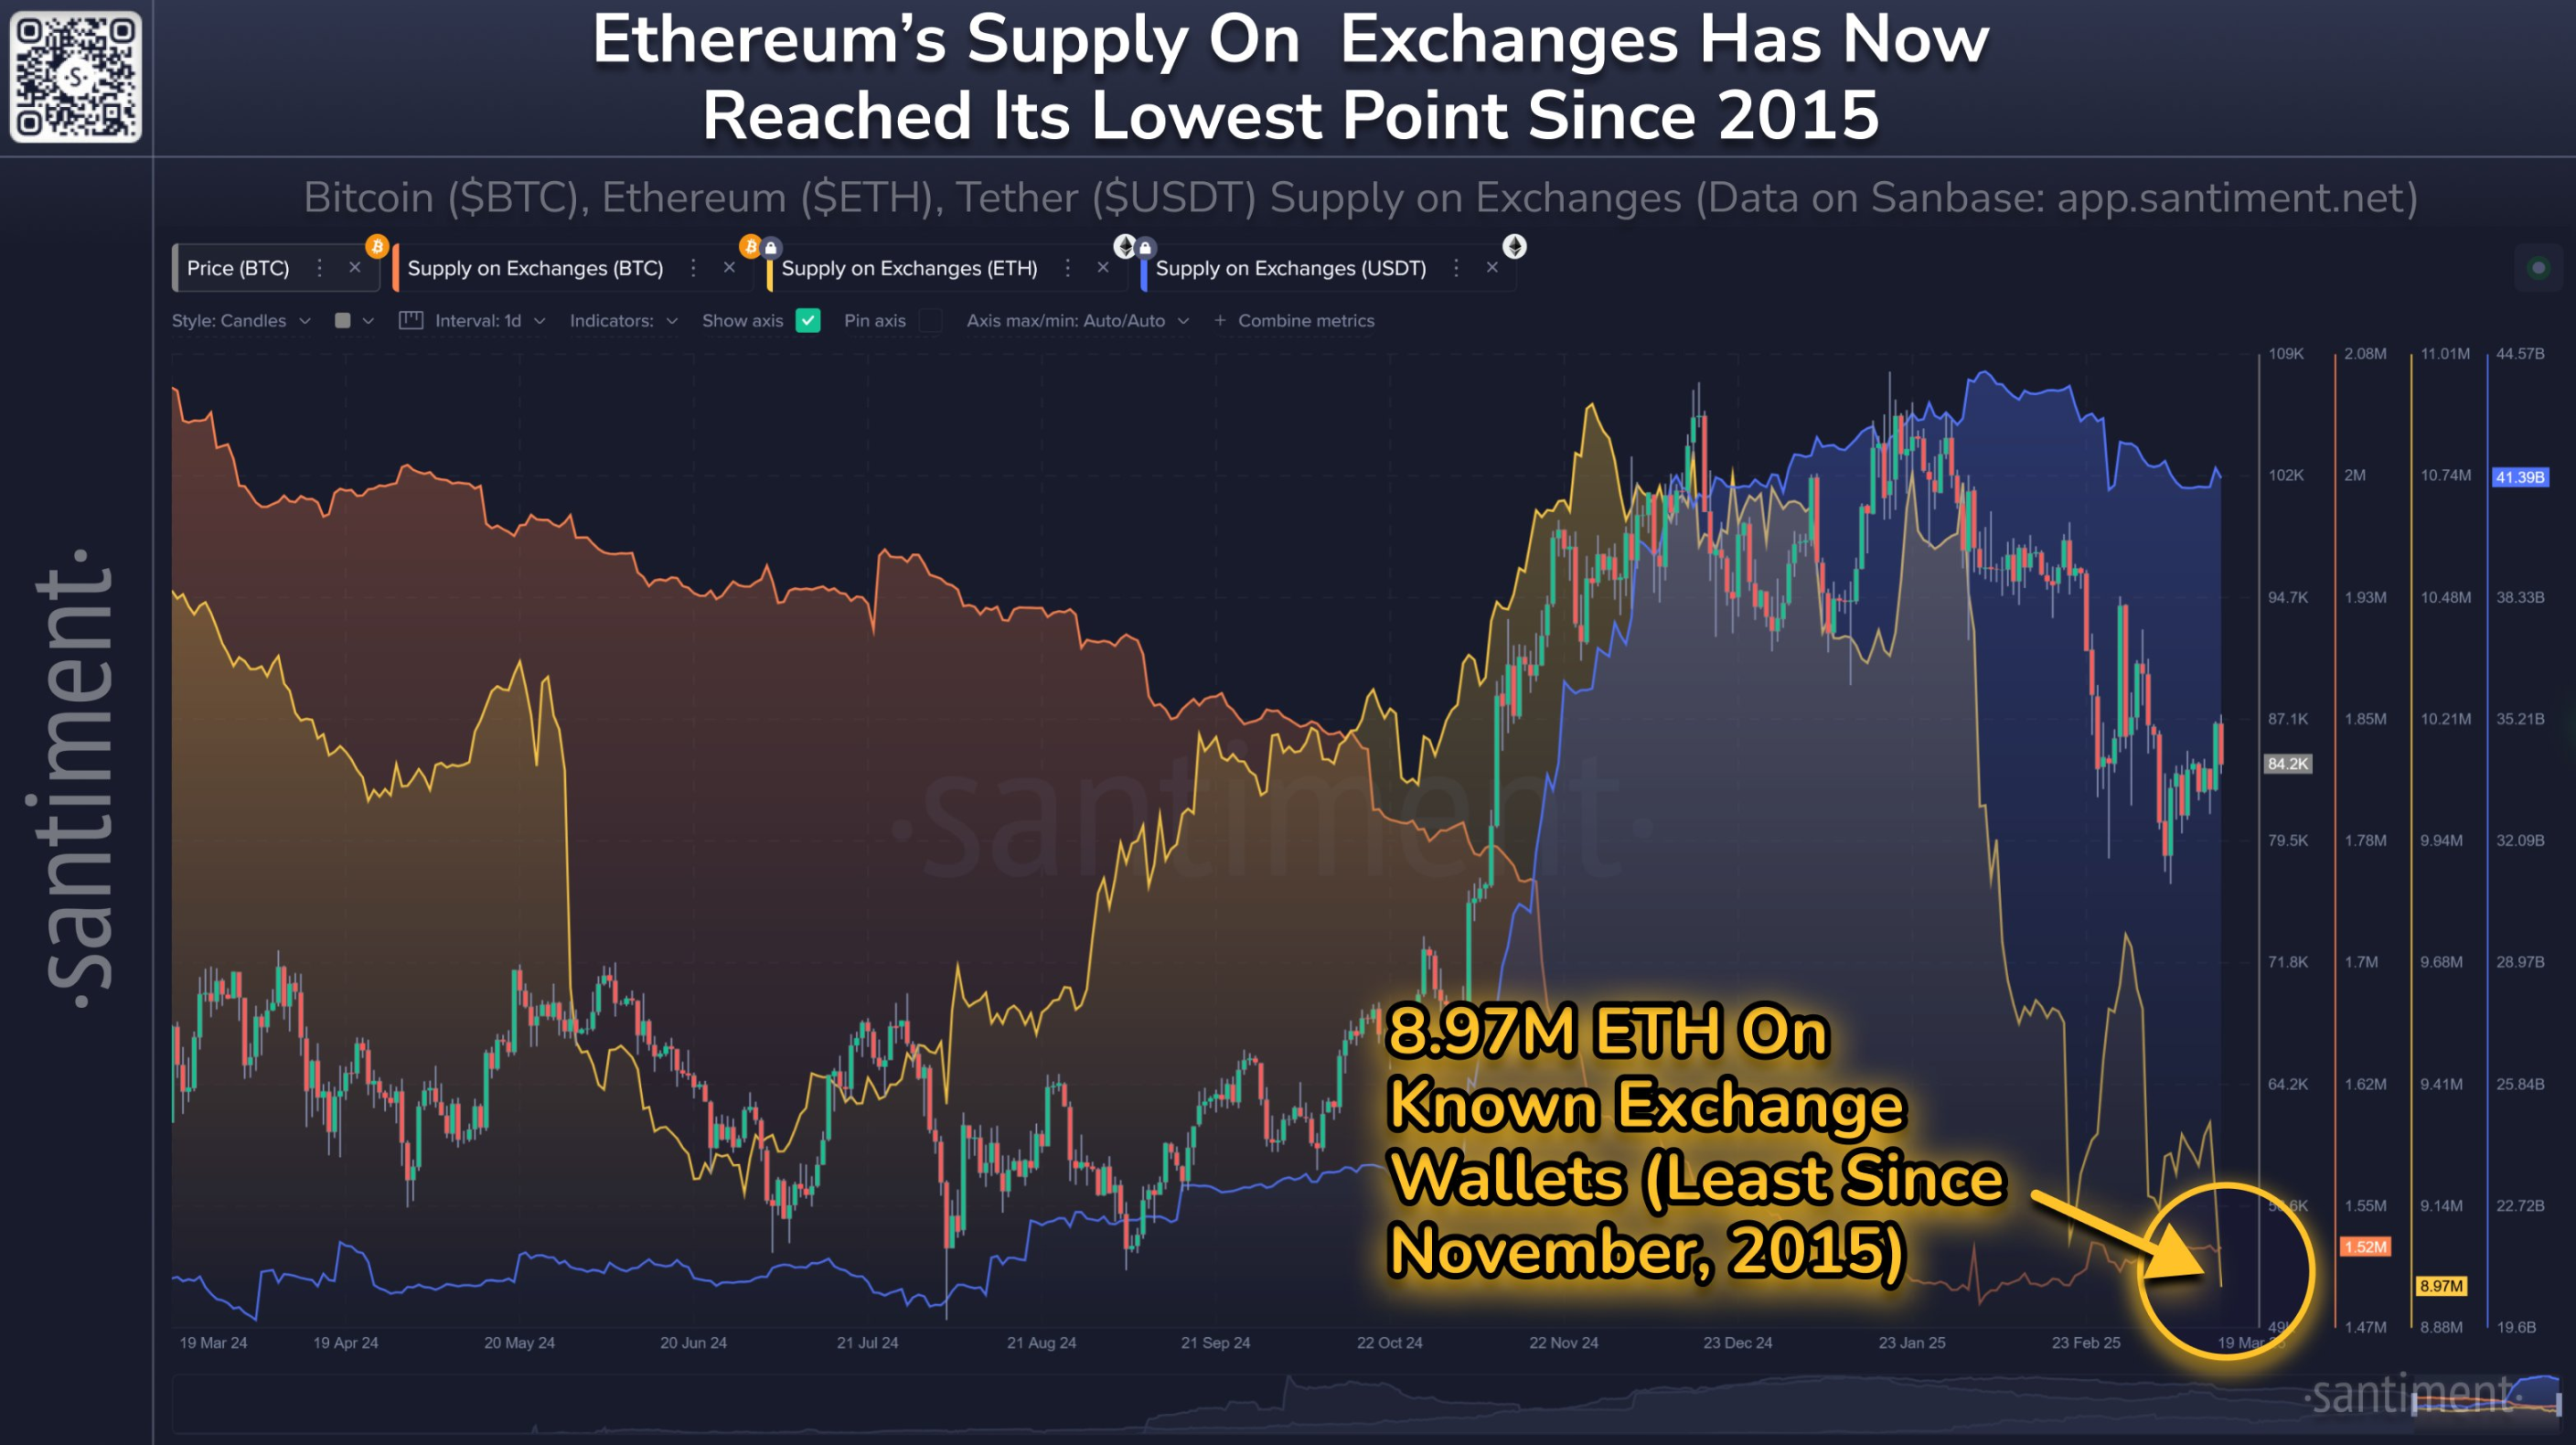
According to data from Santiment, a crypto market analysis agency, the supply of ETH available on the exchange has dropped to 8.97 million due to the attraction of DeFi protocols and pledged products (the current price is equivalent to US$17.8 billion, accounting for less than 7.5% of Ethereum's current market value), the lowest level in nearly 10 years (the previous low was November 2015). Compared with just 7 weeks ago, the trading platform's ETH decreased by 16.4%.
Ethereum exchange supply fell to its lowest in nearly 10 years, indicating a significant tightening of market liquidity. Lower exchange supply means a decrease in ETH used for selling in the market, reducing potential selling pressure, but also makes prices more susceptible to large-scale transactions and increasing volatility.
But from the current state, although the decline in exchange supply shows that the asset lock-in effect is increasing, the overall market environment and multiple factors still put downward pressure on prices. The uncertainty of the current macroeconomic environment, the change in market risk preferences and the withdrawal of some institutional funds have all caused market liquidity to further tighten.
At the same time, the fluctuations in the DeFi field and the development of competitive public chains have also had a negative impact on Ethereum's market expectations. Against this backdrop, while lower exchange supply reduces potential selling pressure, adverse factors from overall market sentiment and external environment still drive prices to continue to decline.
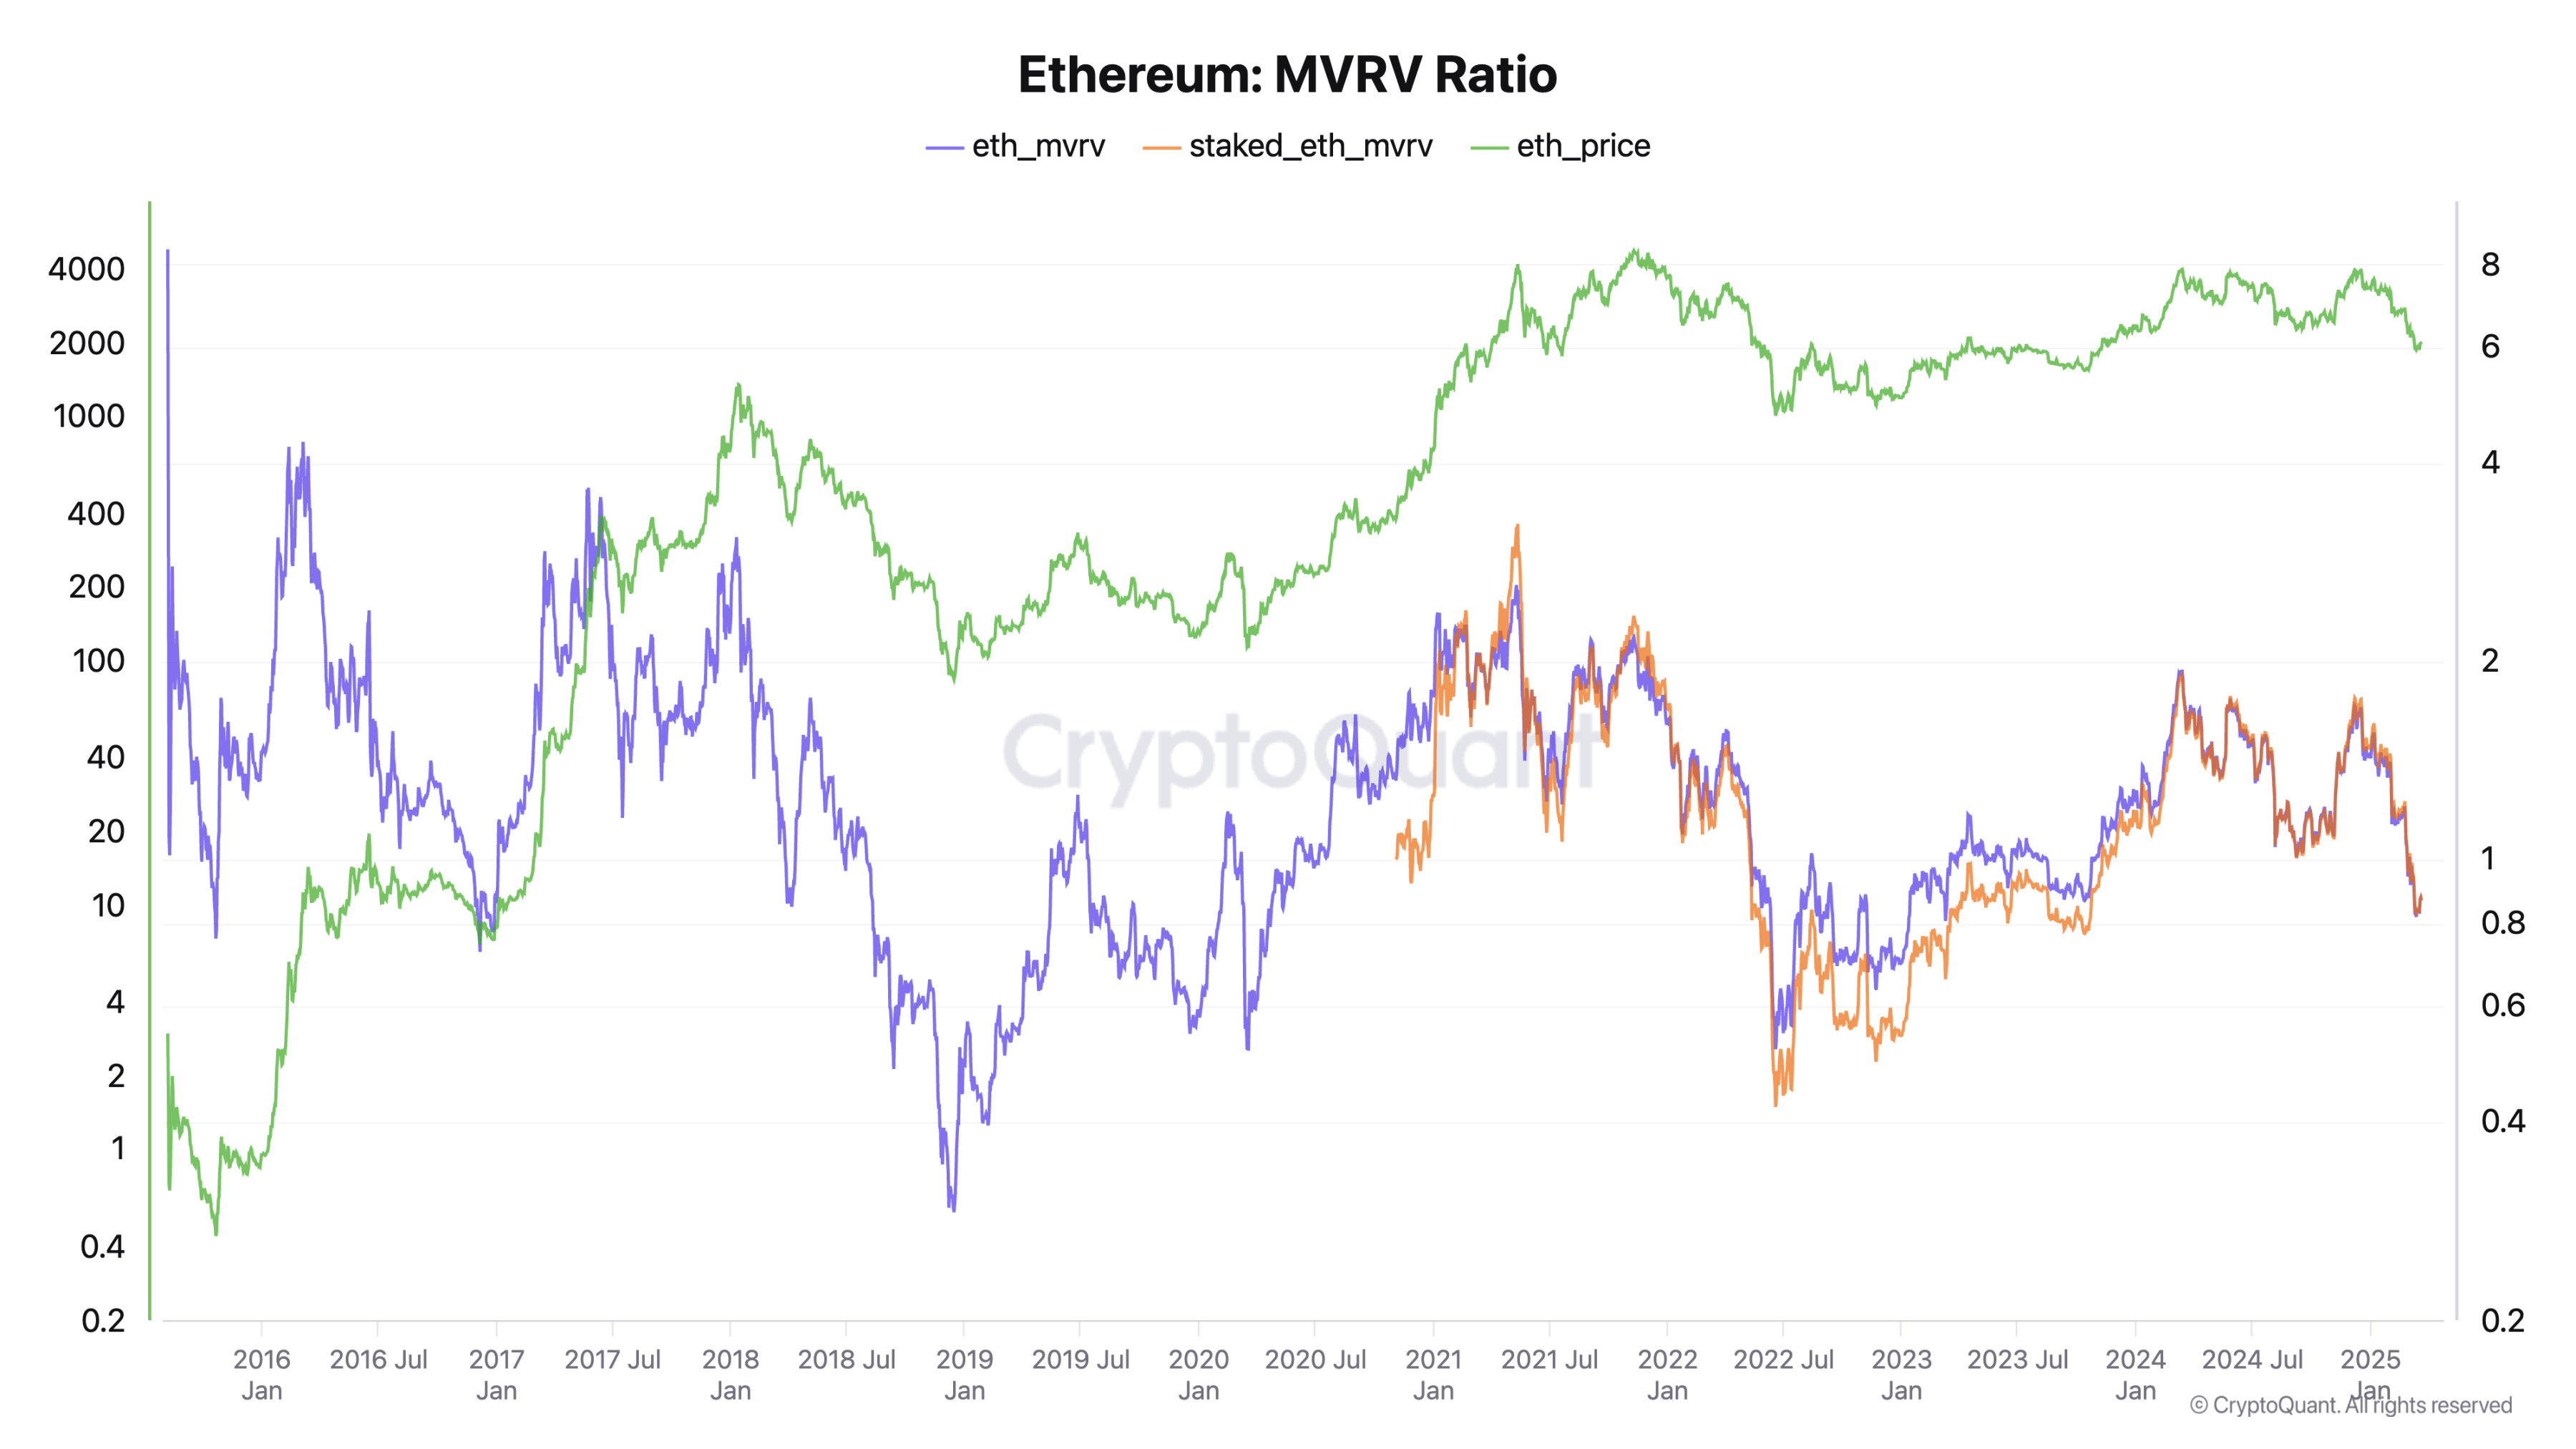
If the current status is detected with the help of indicators, ETH's MVRV (market value to realization ratio) has now dropped to around 0.8, according to IntoTheBlock data. This level is not common in Ethereum history and usually occurs during bear markets.
MVRV is usually used to compare the token's "relationship between market value and realization value" to reflect the supply and demand relationship of a token in the market, and to monitor the current market price of this token is undervalued or overvalued. It is also used to find the top or bottom of this token in the current market.
summary
Looking back on history, Bitcoin experienced a phased correction in October 2023 before a wave of rise. Whether the market will repeat a similar pattern needs further observation. Some analysts such as CryptoQuant founder and CEO Ki Young Ju analyzed that the bull market cycle may be coming to an end in the short term, and the price is more likely to show a bearish or sideways trend in the next 6 to 12 months.
However, the Federal Reserve recently released a signal of loose monetary policy, and the market's expectations of the end of quantitative tightening and the possible restart of quantitative easing have also driven the introduction of some liquidity. BitMEX co-founder Arthur Hayes tweeted, "Powell has fulfilled his promise and the quantitative tightening (QT) basically ends on April 1. Next, if we want to really push the market into a bull market, we either resume the supplementary leverage ratio (SLR) exemption policy or restart quantitative easing (QE). $77,000 may be the bottom of Bitcoin, but the stock market may have to experience another fluctuation before Jay (Powell) will completely turn to the Trump team. So, everyone should be flexible and have cash on hand."
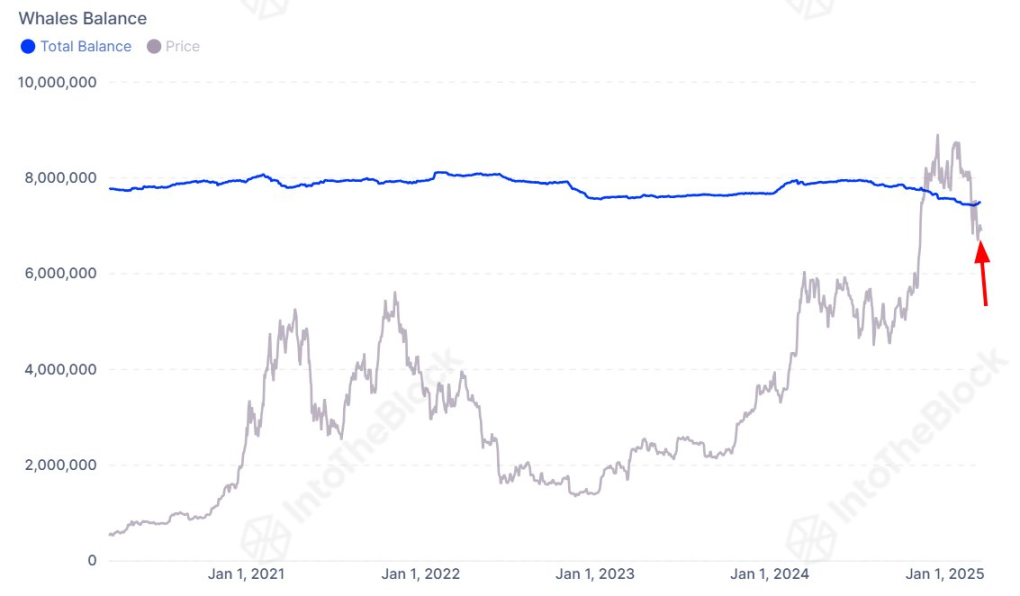
In this environment, the bottom and subsequent reversal of the market are still full of variables, and investors still need to pay close attention to the overall market liquidity, on-chain capital flows, and further changes in institutional giant whales' behavior. For example, IntoTheBlock monitored that although the balance of Bitcoin giant whales has continued to decline in the past nearly a year, March data suggests a possible reversal. Currently, Giant Whale's holdings have increased by about 62,000 BTC from the beginning of this month, showing signs of re-accumulation.
Overall, the current market is undergoing an adjustment period from a high-risk, high-volatility bull market to a low liquidity and risk aversion situation. In the short term, market sentiment is pessimistic, insufficient capital inflows and arbitrage trading unblocking will continue to put downward pressure on prices; while the stability of long-term holders and the re-accumulation of some giant whales may provide necessary support for the market in the future.

 jinse
jinse