
5 Big Data Interpretation of the Current Market: Is it in the stage bottom range?

Reprinted from panewslab
02/12/2025·2MOriginal author: 1912212.eth, Foresight News
Since the market fell from the top in December 2024, the market has fluctuated for several months. Many players have suffered heavy losses in the endless downward trend and volatile markets. The market noise is also serious differences between bulls and bears and bulls and bears. The macro environment is unstable, Trump wields the tariff stick, the Federal Reserve's interest rate cut is still far away, market liquidity is tightening, and community pessimism spreads.
So how is the crypto market progressing? If Bitcoin still has room for subsequent upward trend, is it the bottom range of the market stage now?
1. Panic index has been below 40 since February this year
The CMC Fear and Greed Index is the overall sentiment used on CoinMarketCap to measure the cryptocurrency market. The index ranges from 0 to 100. The lower the value indicates the market's extreme fear, and the higher the value indicates the market's extreme greed. The index helps investors understand the emotional state of the market and thus plan buying and selling decisions. In addition, it can provide reference information on whether the market is undervalued (extremely feared) or overvalued (extremely greedy).
As shown in the figure above, from July to early October 2024, the market experienced panic many times. The index fell below 40 (panic), and then FOMO sentiment appeared in November of that year. The index once exceeded 80, and then the market fell. At present, the market has fallen below 40 again since early February this year.
When the market's panic index is lower, it often means that the currency price may be in a phased bottom range.
2. Bitcoin’s 7-day average fund interest rate fell 85% compared with December last year
The 7-day average capital interest rate of perpetual contracts can be used as one of the important indicators for observing market sentiment. When the market is booming, the interest rate of funds often remains high, and it is often the top range of the market cycle. On the contrary, it often becomes the bottom range of the market.
As shown in the figure above, BTC's 7-day average capital rate once exceeded 0.06% in March 2024, indicating that the market's long funds are willing to pay high costs to short funds. The market sentiment is extremely FOMO, which also became the highest point in the Q1 quarter of that year. . From November to December 2024, its capital interest rate was still above 0.03%, and Bitcoin also broke through the $100,000 mark at this time. However, before the market took off, Bitcoin's 7-day average capital interest rate reached May of that year. There was a negative interest rate in October.
As of the time of writing, the funding rate once reached 0.004%, down 85% from the peak in December. Market sentiment is in a pessimistic state.
3. ETH's profit ratio hits a new low in 4 months
Ethereum's market value has fallen 36% since its local high seven weeks ago, resulting in a sharp drop in the number of ETH in profitable state. Judging from the daily closing data, the current ETH profit ratio hits a 4-month low, and the number of profitable tokens has also dropped to the lowest level in 3 months.
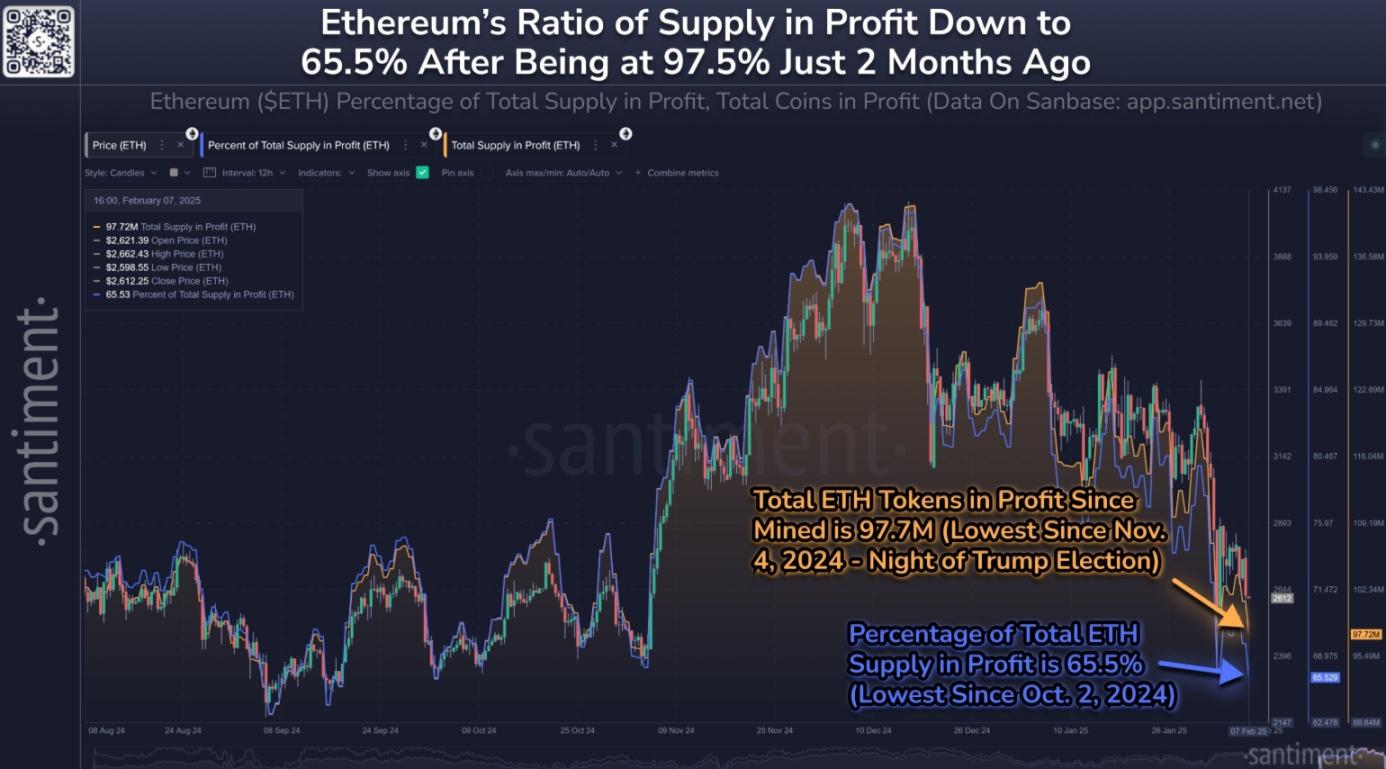
As the second largest cryptocurrency in market value, Ethereum performed worse than other large-cap currencies, and market sentiment has fallen into significant negative. Although the current panic (FUD) and retail investors continue to sell, once the crypto market stabilizes, Ethereum may rebound.
4. Bitcoin miners surrendered again since early February this year, and mining difficulty has increased instead of falling.
The surrender of Bitcoin miners is often regarded as one of the important reference indicators at the bottom of the market. The surrender of miners means that the profit of mining a bitcoin is lower than the cost. According to historical data, it is often the bottom range of the market when Bitcoin miners surrender.
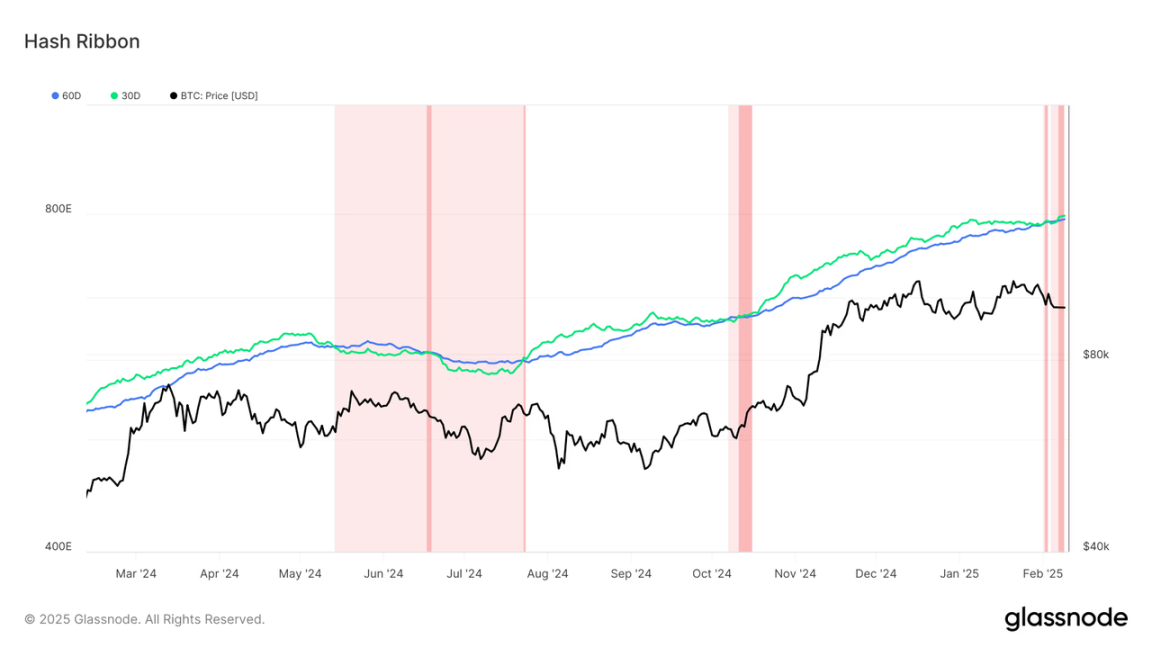
The above picture shows that since 2024, Bitcoin miners have surrendered in June and October this year. Bitcoin miners have begun to surrender since February for the first time since 2025.
Meanwhile, the difficulty of Bitcoin mining has recently hit a record high of 114.7 T. The difficulty level is a new high usually indicates that miners are still optimistic about the long-term value of Bitcoin, otherwise they will not continue to invest in computing power. This may have a certain positive impact on market sentiment.
5. The market value of stablecoins has not decreased but increased in the past month
Stablecoin data is one of the important reference data to observe market capital inflows. In the past month, according to DefiLlama, USDT's market value increased by 3.4% (US$4.676 billion), while USDC rose by 22.73% (US$10.396 billion).
From January 1, 2025, USDT's market value has risen from US$137.17 billion to the current US$141.9 billion, an increase of US$4.73 billion.
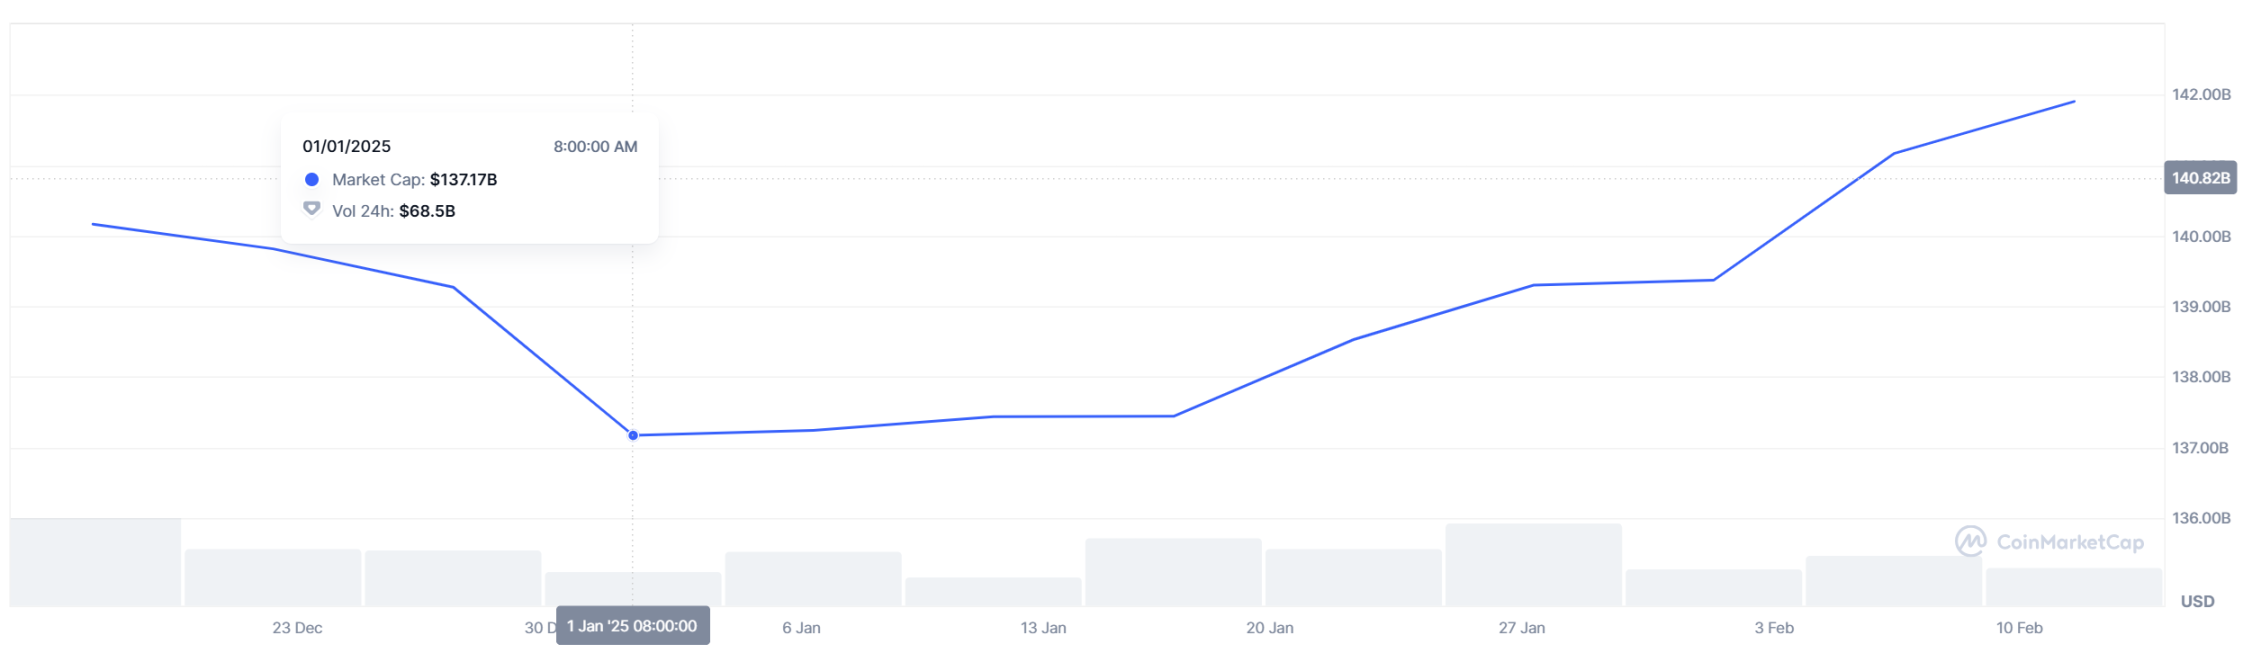
USDC data increased from US$43.77 billion to today's US$56.28 billion.
summary
The above 5 big data may imply that the market may be in a phased bottom range, and it is difficult to assert when the market will leave the bottom range. It is worth noting that even if some tokens are currently in the bottom range, some tokens that are not popular, narrative, fundamentals, and are constantly unlocking are difficult to gain financial attention and may face the dilemma of continuing to decline.


 jinse
jinse