2024 Airdrop Revealed: Exploring Opportunities to Get Rich and Avoiding Risk Traps

Reprinted from panewslab
01/23/2025·3MAuthor: 0x老东
2024 airdrop list
- The FDV top spot on the day of launch: StarkNet, US$19.2 billion.
- The highest airdrop value: Hyperliquid, 2.613 billion U.S. dollars, with an average single address of 28,000 U.
- 0 The top spot on the list: Movement, $734.8 million airdrop.
- The top number of airdrop addresses: HMSTR, 129 million TG accounts, average 3U.
- Number one on the increase list: UXLINK, ATH compared to the closing price of the day 15 times.
- Number one on the decline list: HLG, price dropped 90.66% in 30 days
core insights
-
Emerging narrative tracks are on the rise, and traditional popular tracks are cooling down. The 30-day average increase of old popular tracks (Infrastructure, Layer2, GameFi) is -1.34%, and the 30-day average increase of new narrative tracks such as DEPIN, RWA, AI, etc. is 41.98%. Investors should pay attention to emerging tracks
-
Project valuations in 2024 are on the high side, and market expectations are optimistic. On the day of launch, the average FDV/financing of 79 projects was 103.9 times, indicating that the overall project valuation in 2024 is on the high side, and market expectations are relatively optimistic, but there may be a certain bubble.
-
Speculative operations were frequent in the early stage and prices fluctuated violently. 40% of the projects reached ATH on the first day, and 1% of the projects reached ATL on the first day. This shows that the initial selling pressure of most projects is high, and a large number of investors tend to speculate in the early stages of launch. The subsequent surge may lead to a rapid price drop.
-
Most projects have an obvious price downward trend in the short term. 62% of the projects showed a downward trend within 7 days, and 65% of the projects showed a downward trend within 30 days. Most projects faced a downward trend in prices in the short term after TGE, and over time As time went on, the proportion and magnitude of the decline increased.
-
Projects with a large distribution ratio and few lock-up mechanisms perform better. Projects with a large distribution ratio are generally relatively stable and perform well, with an average 30-day increase of 16.66%. Tokens with lock-up mechanisms performed poorly, with an average 30-day decline of -43.73%.
-
More platforms bring higher recognition. With the increase in the number of online exchanges, the average financing amount and FDV of the project have increased significantly, indicating that market recognition and liquidity have increased, and risk tolerance has also been improved.
Preface
2024 is the year of bull and bear transition, and it is also a year of extremely violent fluctuations in the crypto market. BTC has gone from a low of $38,500 at the beginning of the year to all-time highs, climbing to over $100,000. At the same time, as the market heats up, the activities of project parties have gradually become more frequent.
Compared with only 270 TGE projects in 2023, this number will surge to 731 in 2024, an increase of 170%. Among these many projects, only a few are "big hair" and "medium hair", and most are still "small hair" and "diaochao". What is the performance of these projects after they go online?
To answer this question, Lao Dong selected 100 relatively hot and representative projects in 24 years, and conducted a systematic analysis based on key data such as financing scale, price performance, and distribution rules to reveal the trends and patterns of current airdrop projects. This article will use data to help readers see clearly the situation of airdrop projects in 2024.
Data table: Click to view detailed data
This article does not provide any investment advice, only objective data statistics and analysis.
data analysis
1. Analysis of TGE track in 2024
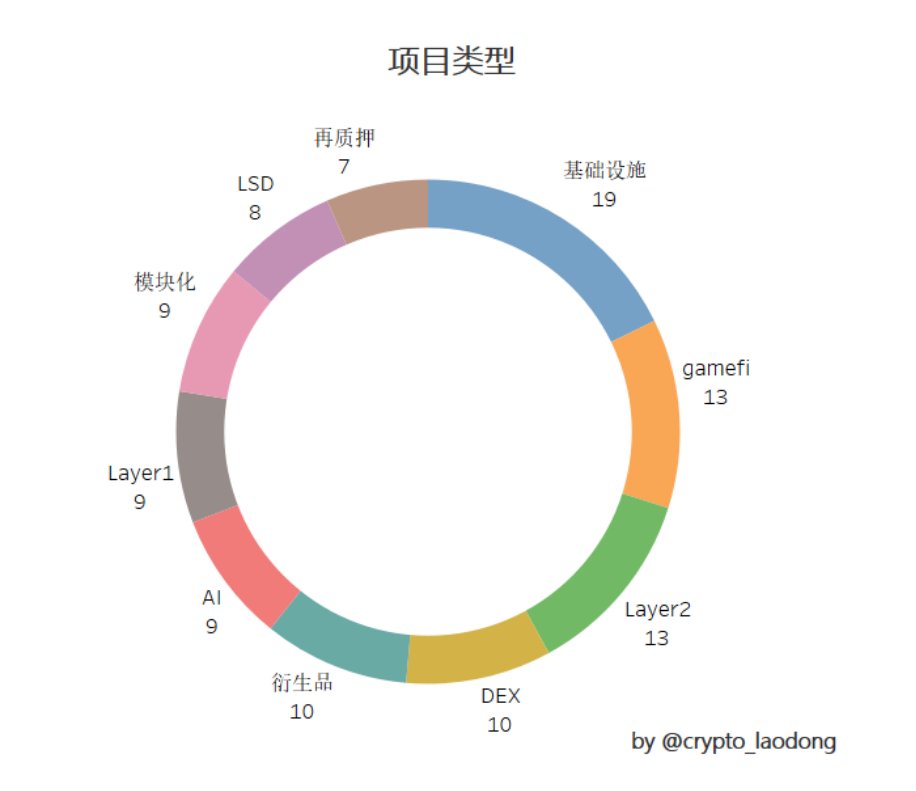
The chart shows the distribution of project types in 2024. It can be seen that the VC currency TGE in 2024 is mainly concentrated in traditional popular tracks such as infrastructure, GameFi, and Layer2. Projects for these circuits often require long construction cycles, with many of them actually being developed over the past few years and not coming online until 2024.
- Infrastructure projects: 19, 30-day average increase of 12.18%
- Layer 2 projects: 12, 30-day average increase -0.2%
- Gamefi’s projects: 12, 30-day average increase of 2.3%
The main emerging popular narratives this year revolve around DEPIN, RWA, AI and other directions. There are not many TGE projects in general, but the performance of this type of projects is very eye-catching. Outbreaks may continue in the future.
- AI projects: 3, with an average increase of 24.56% in 30 days
- DEPIN’s projects: 3, with an average increase of 53.56% in 30 days
- RWA’s projects: 3, with an average increase of 42.17% in 30 days
Traditional popular tracks are gradually cooling down, and emerging narratives are rising rapidly. Focusing on new narrative tracks may be a better investment direction.
2. Financing situation and FDV analysis
Among the 100 projects, 79 projects announced financing, with an average financing amount of US$38.91 million.
- There are 8 projects with financing exceeding US$100 million.
- Projects in the range of US$10 million to US$100 million accounted for the largest proportion, with 44 projects.
- There are 26 projects ranging from US$2 million to US$10 million.
VC institutions usually conduct strict due diligence on projects, which reflects the market's recognition of the project. The larger the amount, the greater the investor's confidence in its future development. Through the frequency of financing, we can also judge the changes in the popularity of the track and the direction of capital attention. However, the amount of financing does not completely determine the quality of the project. We need to analyze it in multiple dimensions.
FDV (fully diluted market capitalization) is a metric used to assess a project's potential future value. FDV will be affected by multiple factors before the project goes online, including financing amount, initial circulation, market sentiment, narrative direction, track popularity, liquidity and transaction depth, etc.
In order to more objectively evaluate the relationship between the initial project valuation and actual financing, we use the FDV/financing ratio of the closing price of the day to divide the range and analyze the market performance of projects in different ranges:
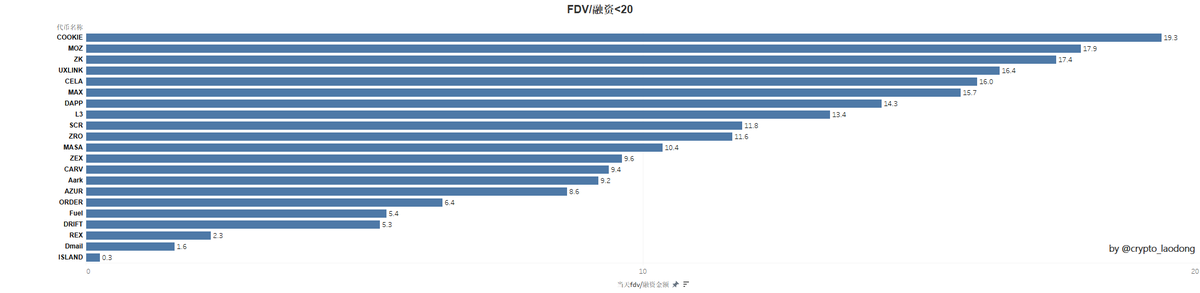
FDV/financing 0-20 range: reasonable or conservative
There are 21 projects in this range, with an average financing amount of US$48.83 million. Data shows that the price trend of 57% of the projects within 7 days and 30 days failed to exceed the closing price of the day. Compared with other ranges, the market expectations of these projects are relatively stable, the valuations are relatively reasonable, and the investment risks are low.
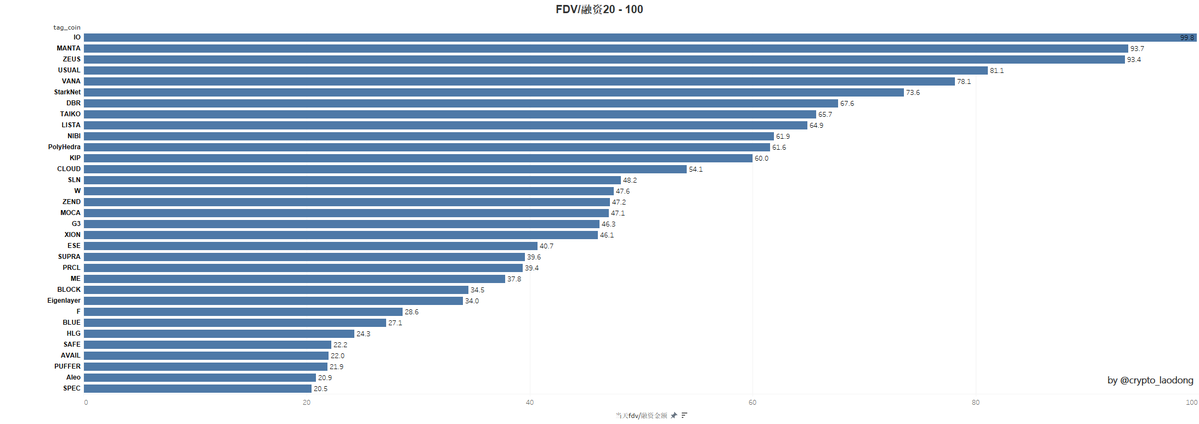
FDV/financing 20-100 range: expectations are high
A total of 33 projects are in this range, with an average financing amount of US$51.64 million. Statistics show that 63.6% of projects experienced weakening prices within 7 days, and this proportion increased to 75.8% after 30 days, indicating that investors had high initial expectations for these projects, but in the short term there was a large price correction and certain fluctuations. risk.
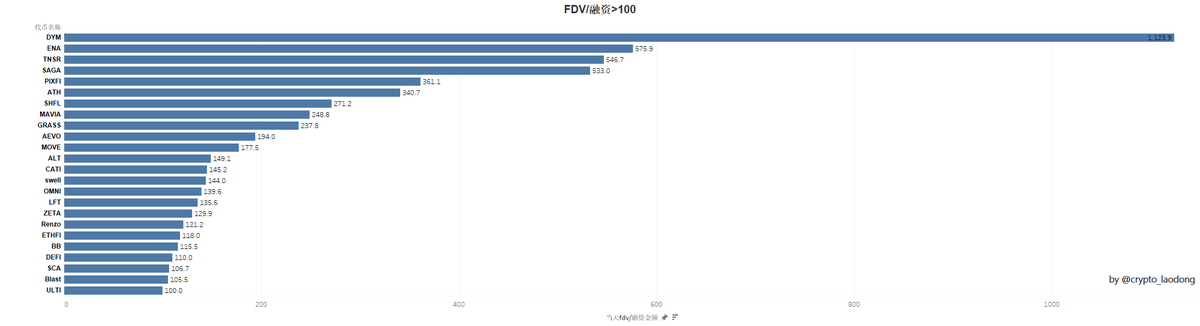
FDV/financing range above 100: high-risk speculation
This range includes 24 projects, with an average financing amount of US$12.72 million. Most of these projects are small-scale projects with relatively small financing scale, and there are no projects with financing of over 100 million yuan. Data shows that 70.8% of project prices weakened after seven days, and this proportion dropped to 54.2% after 30 days. These projects are mostly concentrated in hot topics such as infrastructure, GameFi, and LSD.
Among the 79 statistical projects, the average FDV/financing ratio is 103.9 times, indicating that the overall valuation of projects in 2024 is relatively high and market expectations are relatively optimistic.
3. ATH vs ATL analysis
Analyzing ATH (all-time high price) and ATL (all-time low price) can help us fully understand the project's overall performance in the market and investor recognition. The analysis of ATH/day's price and day's price/ATL can evaluate the profit potential and selling pressure risk of the project, and provide data support for judging the initial stability, reasonable valuation and investment timing of the project.
Statistics on the price trends of 100 projects show that as of today, 40% of the projects reached ATH on the first day, and 1% of the projects reached ATL on the same day.
Price trend statistics of 100 projects: 40% of projects reached ATH on the first day. 1% of projects hit ATL on the first day.
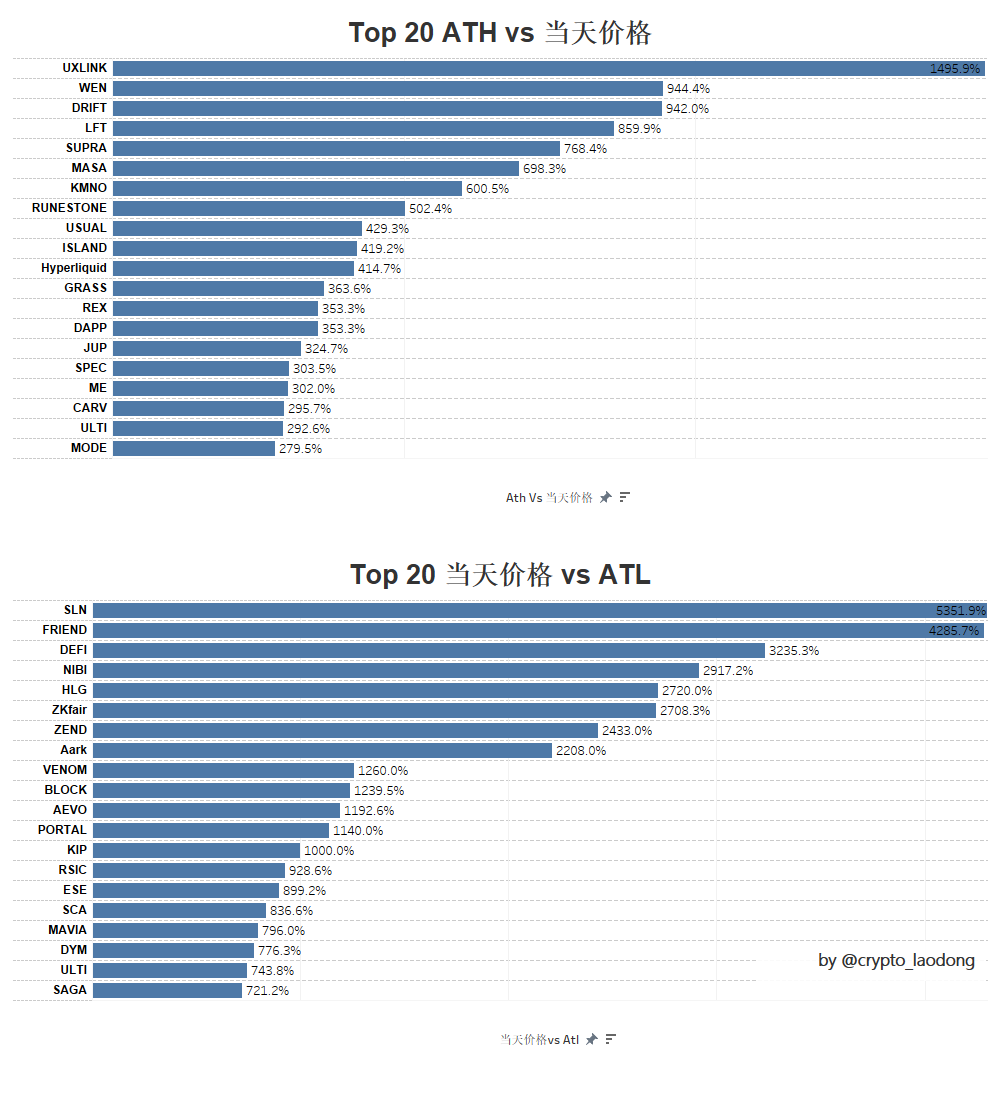
ATH vs. The average price of the day is 245.22%, indicating that the price of the day has the potential to increase 2.45 times from the historical high. Top performing projects include UXLINK, WEN, DRIFT
The price vs. ATL average of that day was 633.52%, which means that it still requires a 6.34-fold increase from the historical low to the closing price of the day. The worst performing projects are SLN, FRIEND, and DEFI
Speculative sentiment is prominent in the market, with 40% of projects reaching ATH on the first day, indicating that a large number of investors tend to speculate in the early stages of launch, which may lead to a rapid price drop later.
The 245.22% increase in ATH and the 633.52% decrease in ATL indicate that the risk of market selling pressure is far greater than the project's profit margin. This data reflects the price fluctuations in the early stages of a project's launch. In most cases, investors are more likely to push prices up quickly due to high market sentiment, but then prices may fall back quickly due to factors such as selling pressure or token unlocking.
4. Comparison of short-term project trends
The main purpose is to analyze the short-term trend of the project. By comparing the closing price of the day with the changes in 7-day and 30-day prices, you can have a clearer understanding of the project's performance and trends in the short term.
As can be seen from the chart:
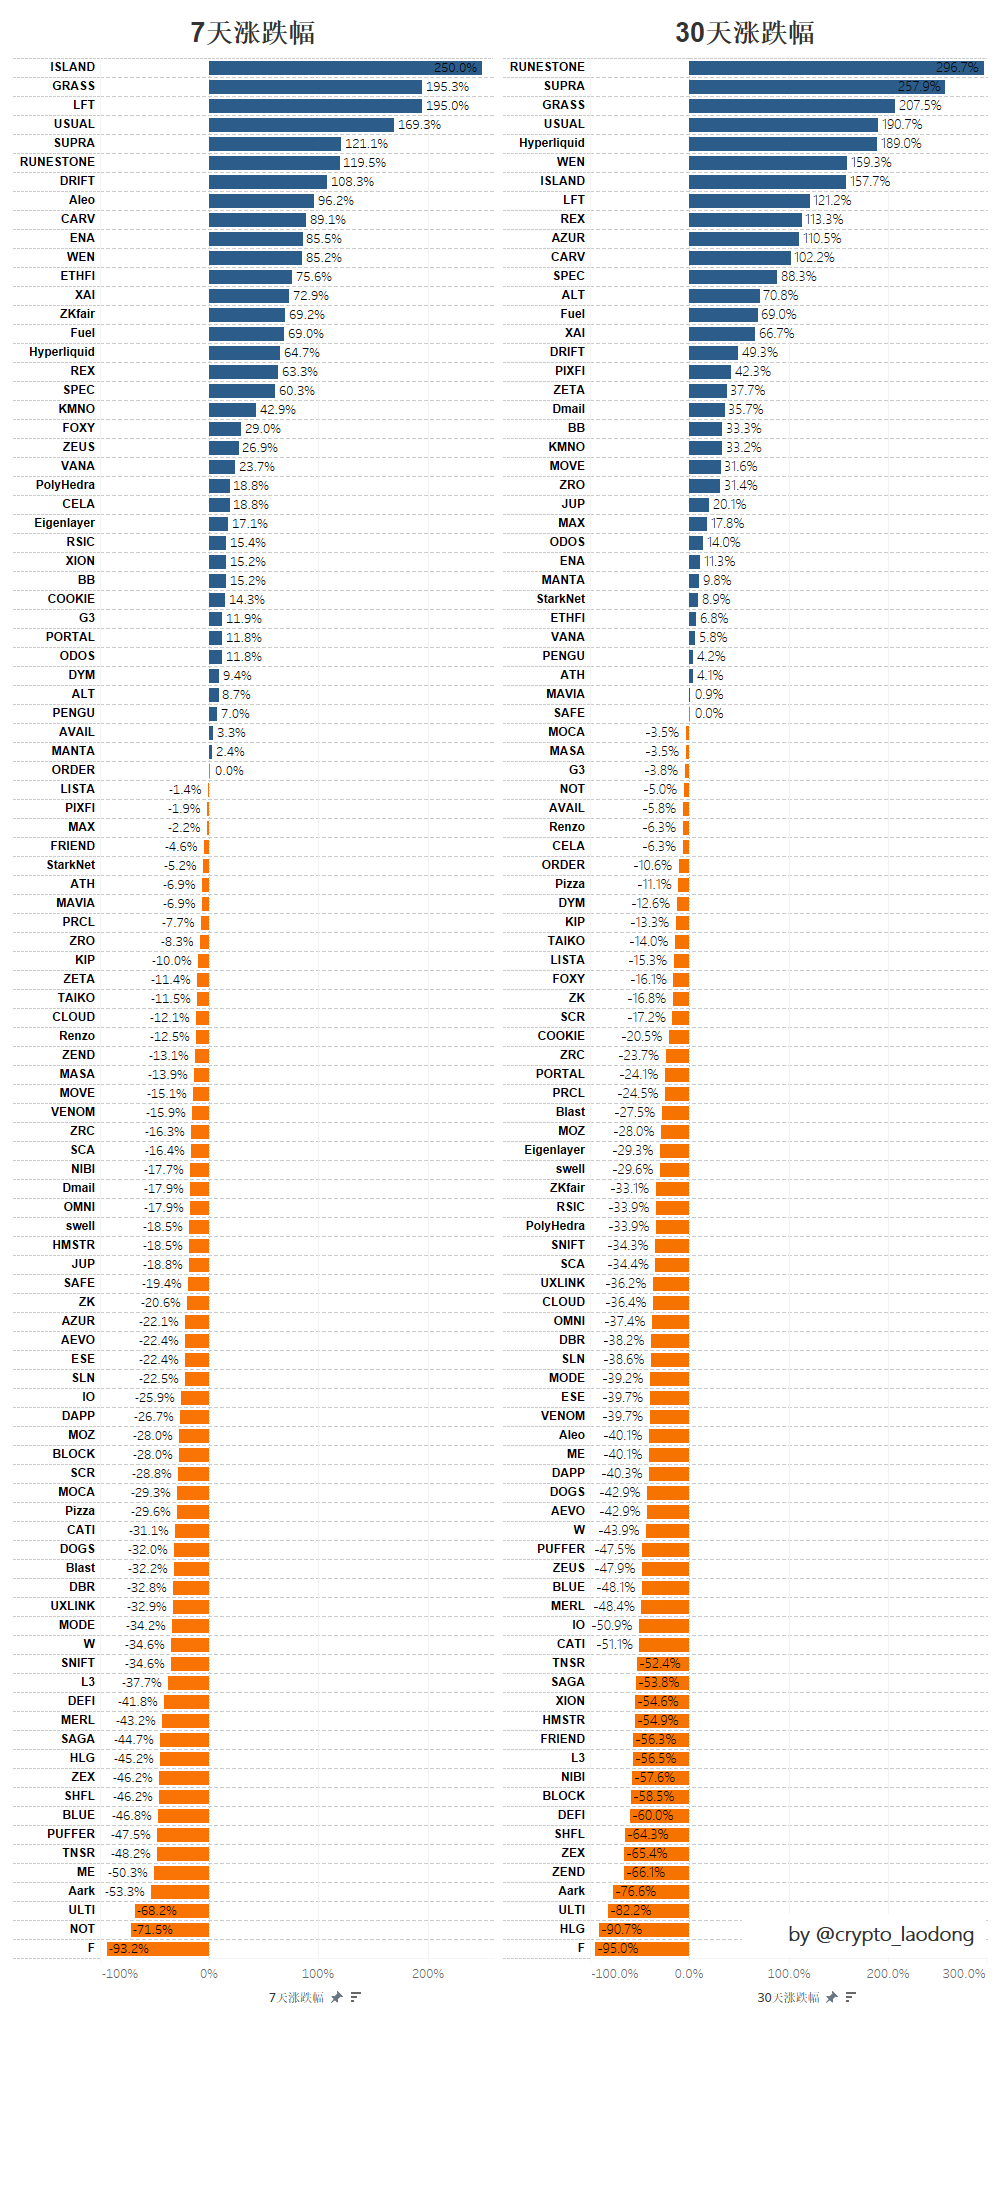
Day 7:
- 62% of the project prices were lower than the closing price of TGE that day, with an average decline of 27.03%.
- 38% of the project prices were higher than the closing price of TGE that day, with an average increase of 60.34%.
Day 30:
- 65% of the project prices were lower than the closing price of TGE that day, with an average decline of 37.42%.
- 35% of the project prices were higher than the closing price of TGE that day, with an average increase of 74.26%.
Most projects faced a price decline trend in the short term after the TGE, and as time went by, the proportion and magnitude of the decline increased.
Although the prices of most projects have fallen, there are still a few projects that have performed well after the TGE and have increased at a relatively high rate. Some high-quality projects can gain higher market recognition and achieve significant price growth in the short term.
Among them, ISLAND GRASS RUNESTONE performed well and F AARK HLG performed the worst.
Possible reasons for the short-term rise:
- Project fundamentals are excellent: Projects with strong technical support, clear application scenarios or innovative business models can usually attract the attention of long-term investors, thereby driving up prices.
- Narrative-driven: Projects that capture current market hot spots (such as GameFi, meme, DEPIN, RWA, etc.) can easily attract market capital inflows, thereby driving up prices.
- Strong community consensus: Community consensus can increase the project's attention and demand in the market, thus driving up prices. At the same time, continued community support can reduce selling pressure and enhance the long-term stability of the project.
- Good liquidity: Good liquidity helps stabilize project prices and enhances investor confidence.
Possible reasons for short-term declines:
- Market sentiment cools: The price of TGE on the day is often driven by FOMO (fear of missing out) sentiment and may be higher than a reasonable price. As the heat subsides, the price will return to rationality.
- Increased selling pressure: After TGE, investors, especially airdrop participants or short-term investors, may choose to cash out profits, leading to increased selling pressure in the market and falling prices.
- Token unlocking mechanism: Many VC coins adopt a long-term release mechanism. As the tokens are unlocked, early investors (such as private equity parties and teams) may choose to cash out their profits, thereby increasing market selling pressure.
- Insufficient liquidity: Some projects after TGE may have insufficient liquidity and limited trading depth. Once a large selling order occurs, the price will fall rapidly and the volatility will increase.
5. The impact of distribution ratio on price
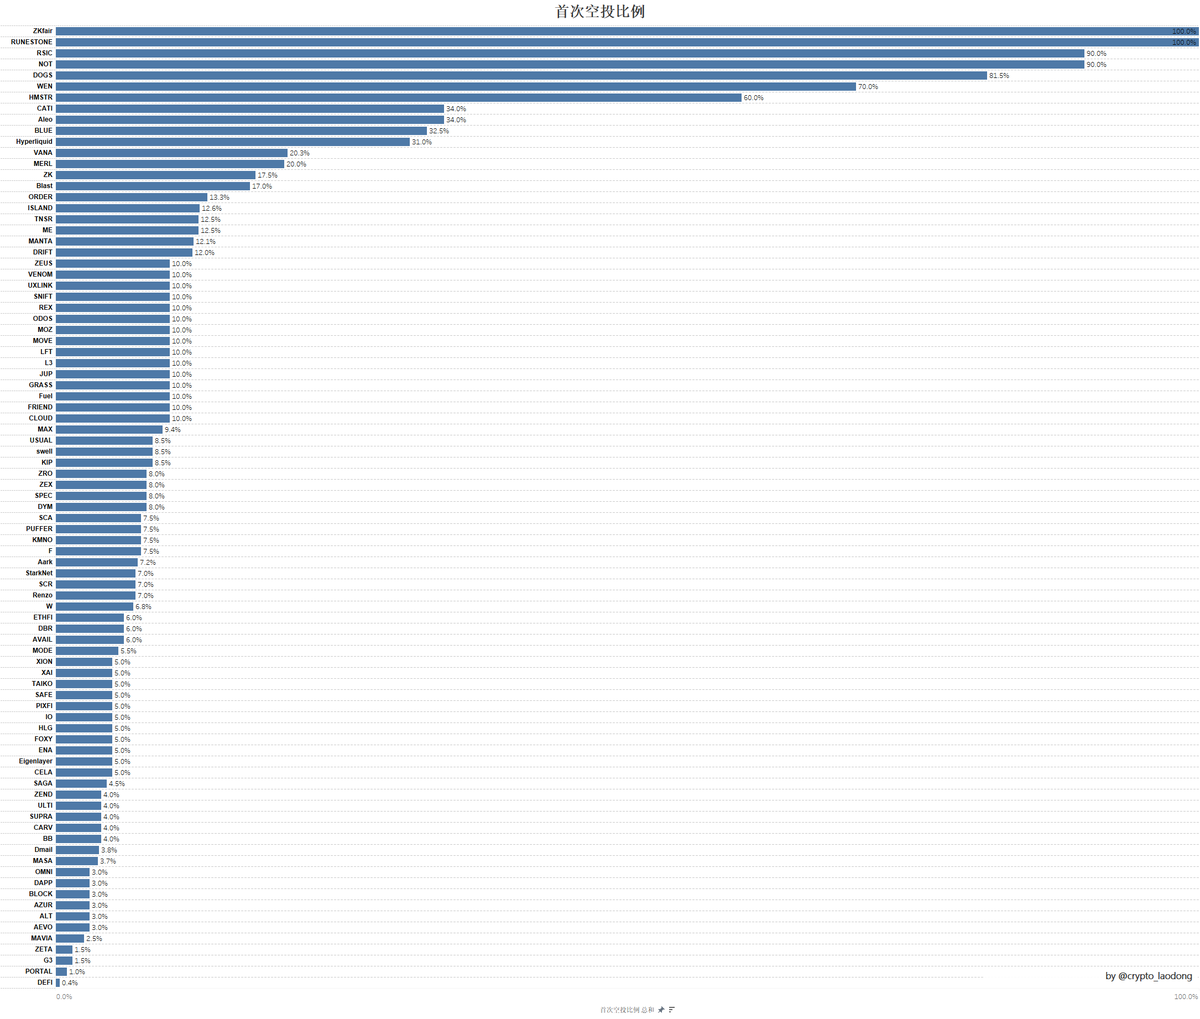
There are 15 projects with airdrop ratio greater than 15%, with a 7-day average increase of 11.87% and a 30-day average increase of 16.66%
There are 76 projects with an airdrop ratio of less than 15%**, with a 7-day average increase of 8.31% and a 30-day average increase of 3.36%.
There are 10 projects with lock-up mechanisms, and the 7-day average decline is -16.68%, and the 30-day average decline is -43.73%
Data shows that projects with a larger proportion of airdrops perform more stably in the short term, while projects with stronger lock-up mechanisms perform less well than expected and experience larger price fluctuations.
6. Exchange selection and project performance
Listing on different exchanges and listing on multiple exchanges usually have different impacts on the market. In order to better understand the overall performance of projects listed on major exchanges, Lao Dong compiled data from several major exchanges, including the number of listings, price increases and decreases, and the impact of FDV liquidity. In this way, you can understand the project performance of different exchanges and make more informed investment decisions.
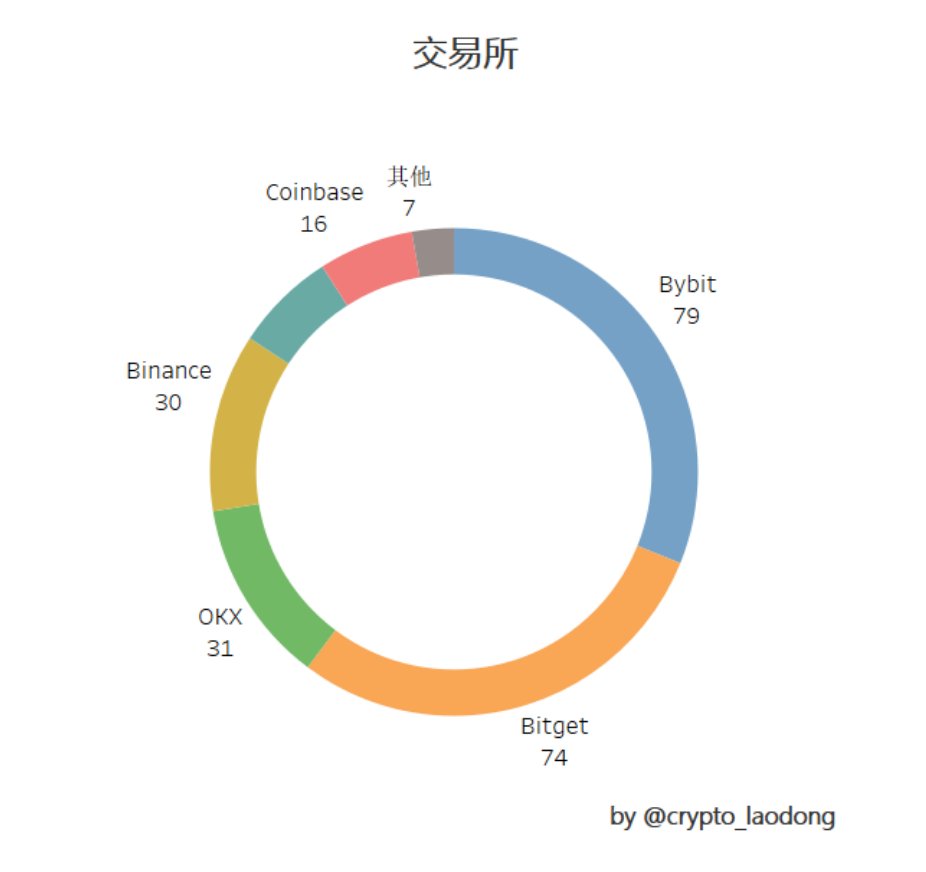
Binance: There are 30 online projects, with a 7-day increase or decrease of -0.02%, 12 rising projects (40%), a 30-day increase or decrease of -4.57%, and 12 rising projects (40%).
OKX: There are 31 online projects, with a 7-day increase or decrease of -13.06%, 7 increase projects (22.58%), a 30-day increase or decrease of -18.75%, and 10 increase projects (32.26%)
Bybit: There are 79 online projects, with a 7-day increase or decrease of +2.27%, 29 rising projects (36.7%), a 30-day rise or fall of -4.65%, and 28 rising projects (35.44%).
Bitget: There are 74 online projects, with a 7-day increase or decrease of +6.57%, 26 increase projects (35.14%), a 30-day increase or decrease of +3.3%, and 28 increase projects (37.84%)
Coinbase: 16 online projects, 7-day increase or decrease -3.68%, 3 increase items (18.75%), 30-day increase or decrease +26.64%, 6 increase items (37.5%)
Upbit: There are 17 online projects, with a 7-day increase or decrease of -5.05%, 3 rising projects (17.65%), a 30-day increase or decrease of +2.94%, and 9 rising projects (52.94%).
Judging from the number of listed coins, Coinbase and Upbit have fewer coins listed. They tend to carefully screen projects, pay more attention to the long-term stability of the project and compliance, and avoid listing projects that are still in the experimental stage or high risk. Bybit and Bitget list more coins and are more aggressive. These exchanges focus on attracting users and expanding market share by frequently launching new projects. This strategy can help them expand quickly in the market and attract large trading volumes and liquidity.
Judging from the short-term price of the project:
Bitget and Bybit perform better within 7 days and 30 days. Bitget, in particular, has a positive increase in both 7 days and 30 days, and has a higher proportion of rising projects.
Coinbase performed relatively well, especially in the 30-day increase, which reached +26.64%, and many projects increased (37.5%).
Both OKX and Binance have shown a certain decline in the past 30 days, especially OKX, which has fallen significantly in 30 days, about -18.75%.
Upbit's performance has rebounded within 30 days, with an increase of +2.94%, and 52.94% of projects have increased, which is a good performance.
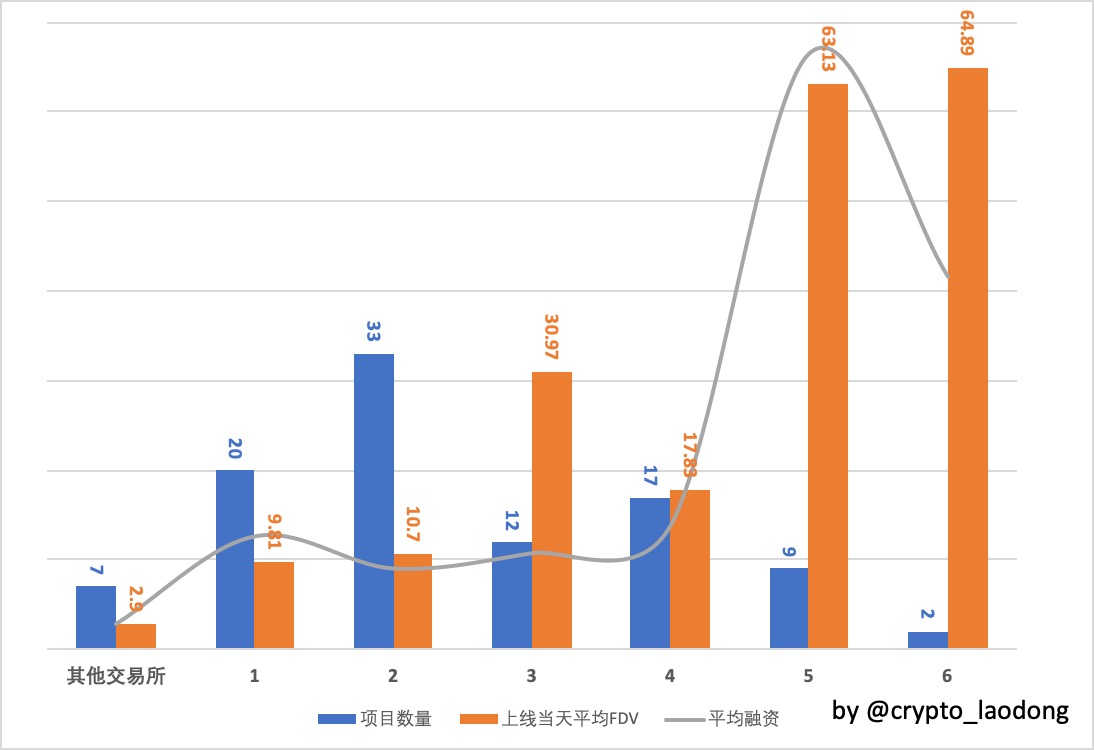
Other exchanges: 7 projects, average financing of 6.5 million, average FDV of 290 million that day
1 exchange launched: 20 projects, average financing of 28.86 million, average FDV of 981 million on the day
Online on 2 exchanges: 33 projects, average financing of 20.68 million, average FDV of the day 1.07 billion
Listed on 3 exchanges: 12 projects, average financing of 24.57 million, average FDV of 3.097 billion that day
Online on 4 exchanges: 17 projects, average financing of 31.67 million, average FDV of the day 1.783 billion
5 exchanges launched: 9 projects, average financing of 152.15 million, average FDV of 6.313 billion on the day
Online on 6 exchanges: 2 projects, average financing of 95.2 million, average FDV of 6.489 billion on the day
With the increase in the number of exchanges on which the project is listed, the average financing amount of the project and the FDV on the day of listing have increased significantly, which means high market recognition, better liquidity, and improved ability to resist risks, which can attract more investors. .

 jinse
jinse